¶ Dashboards
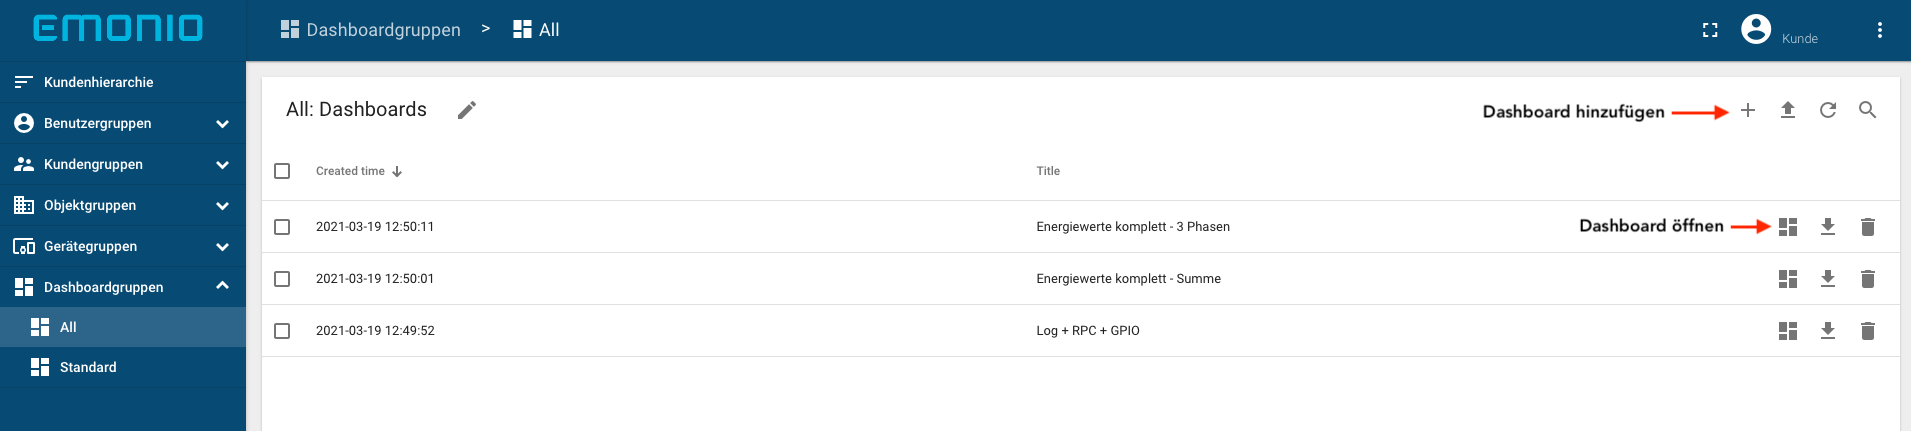
Manage your dashboard groups and dashboards. Use the + symbol to add a new dashboard group. Open a dashboard group to access the dashboards there or to create a new dashboard.
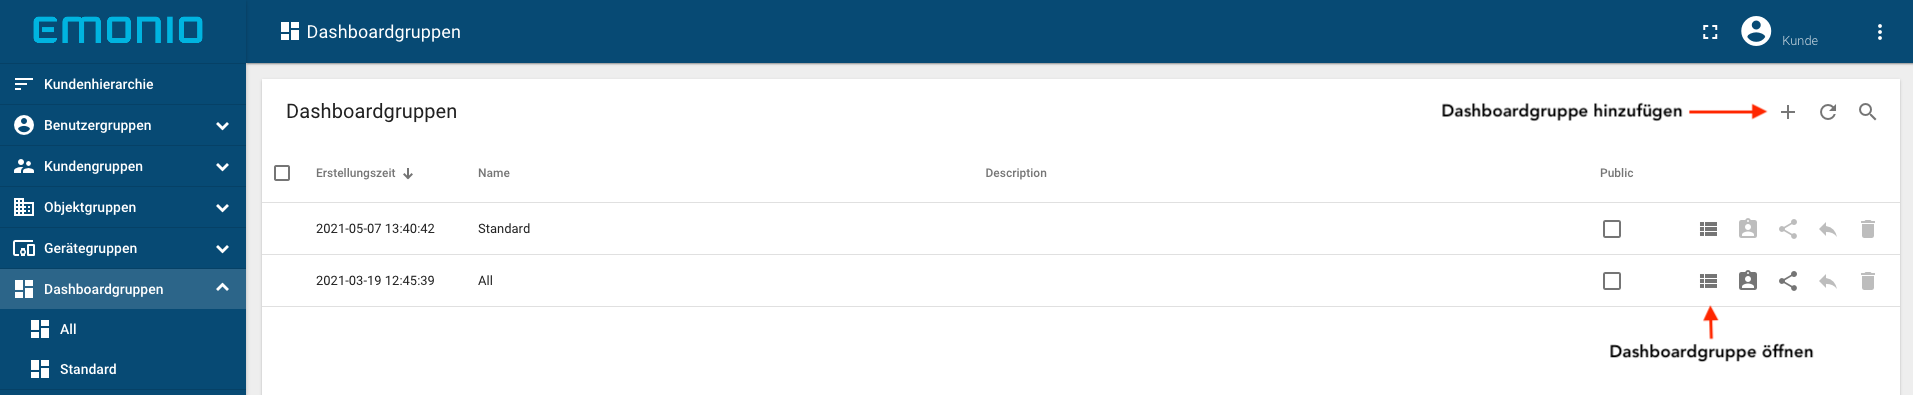
To open a dashboard, click the dashboard icon.
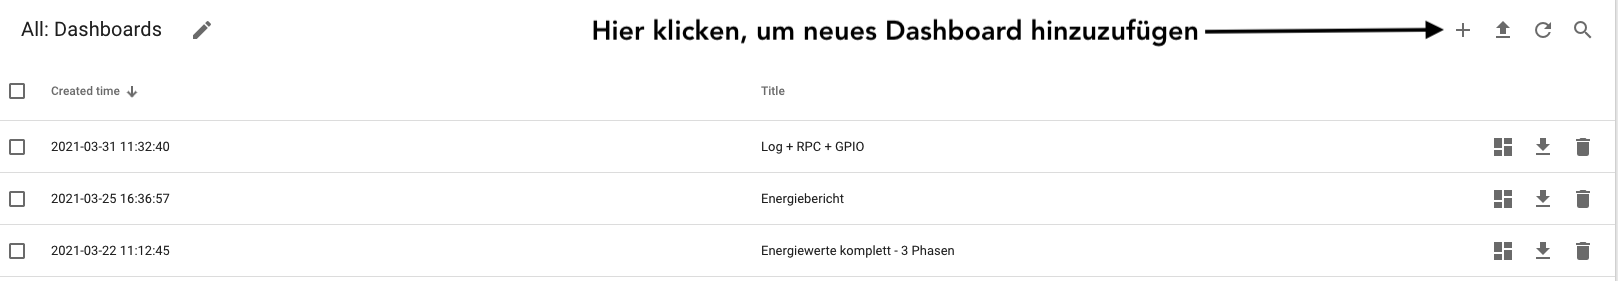
¶ Create
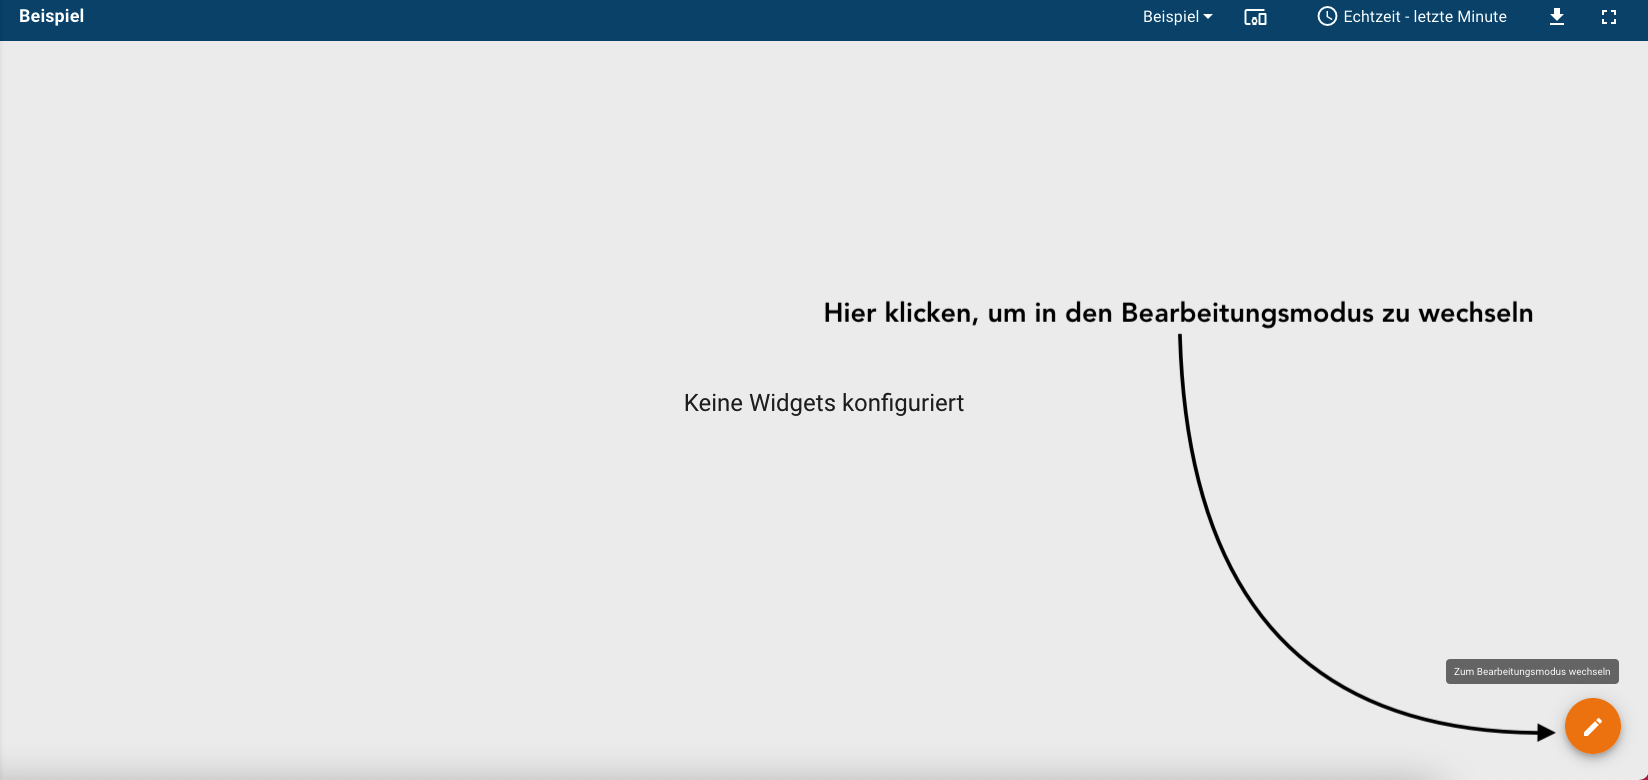
With the + symbol (see image) you create a new dashboard.
Switch to edit mode (see image), to create/change Dashboard-Settings, Entities or Widgets.
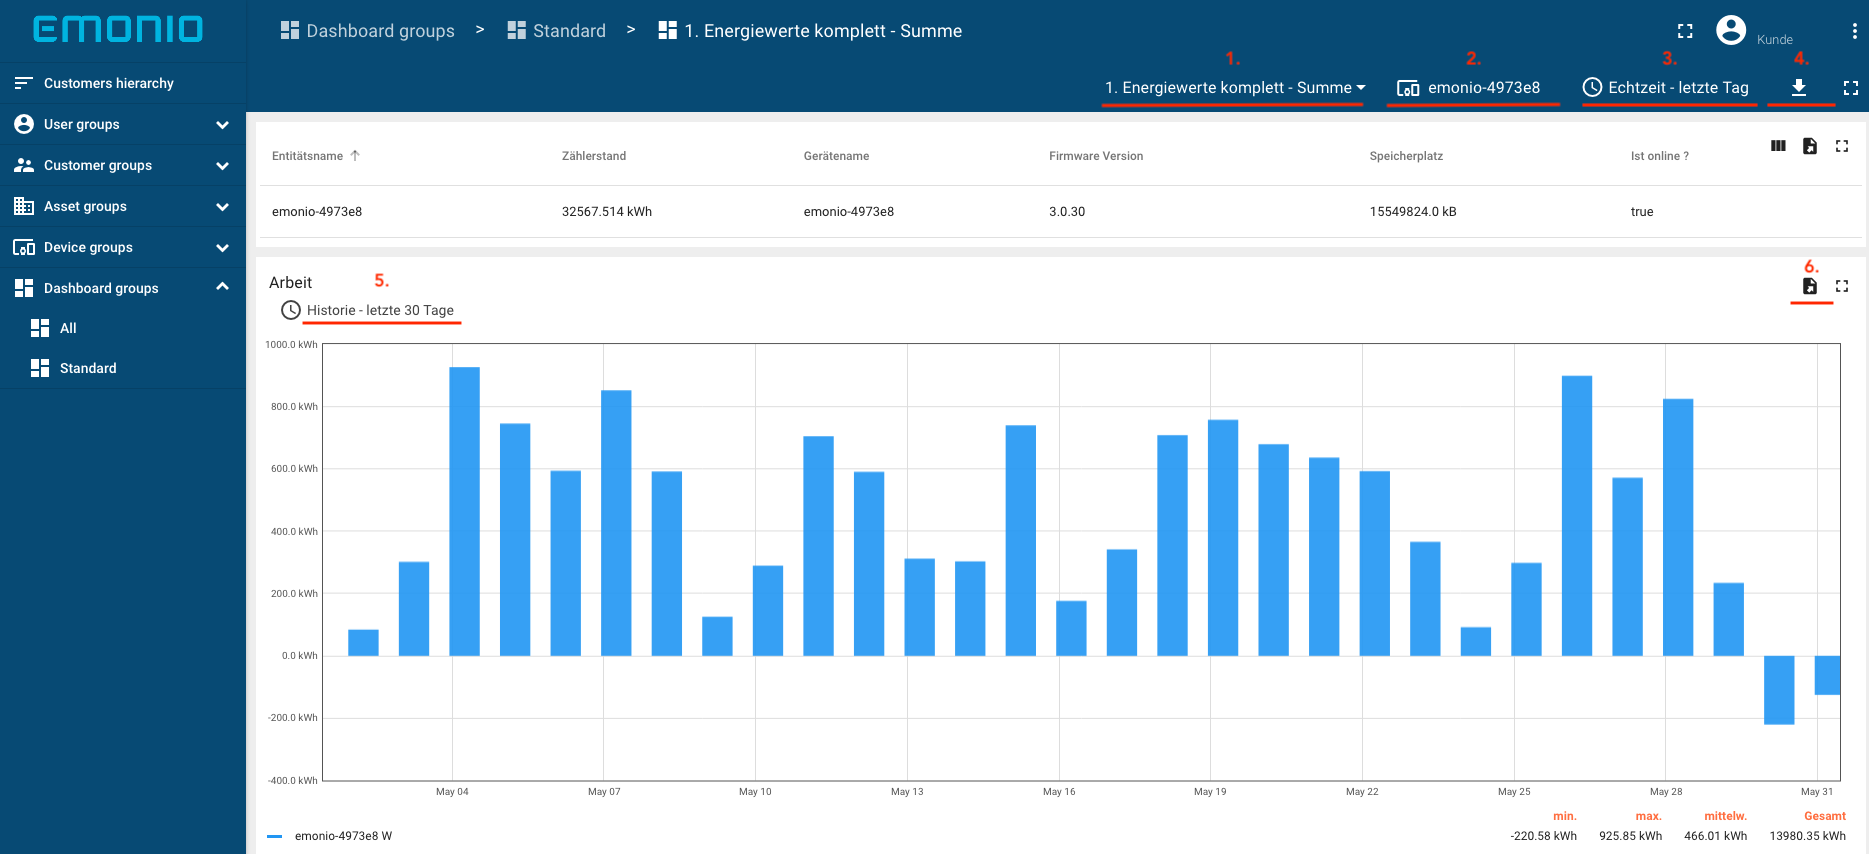
Overview in edit mode:

¶ User Interface
- 1. Dashboard selection
- 2. Selection of the measuring device
- 3. Setting the time window in the dashboard
- 4. Export the dashboard
- 5. Setting the widget's own time window
- 6. Exporting the measurement data of the widget as a CSV or Excel file
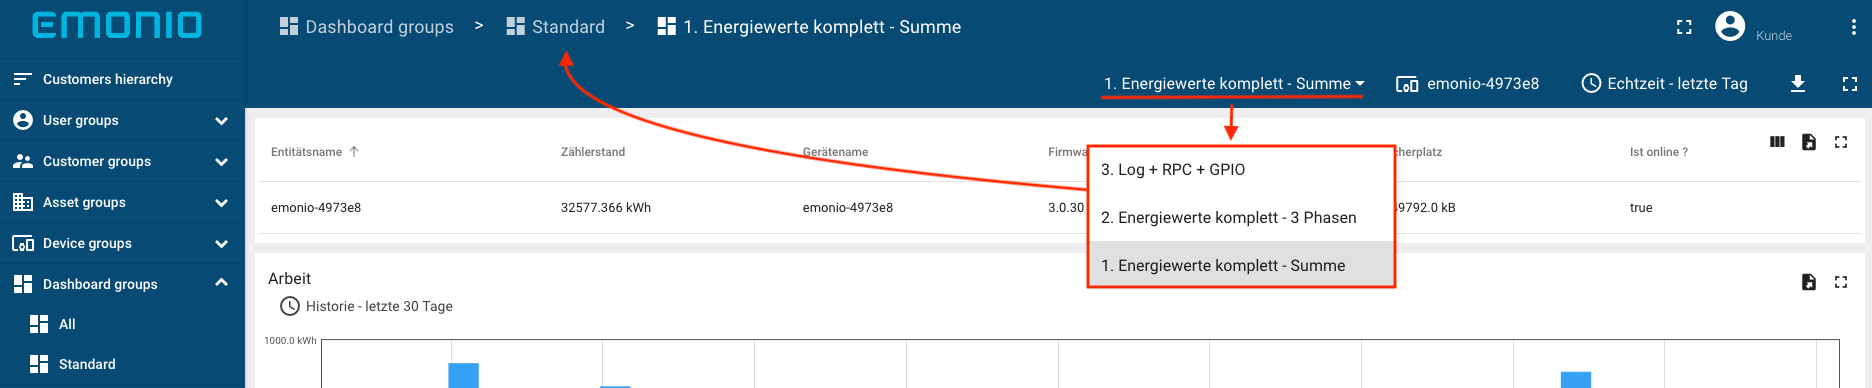
¶ Quick Selection
Use the quick selection to switch between the individual dashboards within the dashboard group. The example shows the dashboard selection of the "Standard" dashboard group.
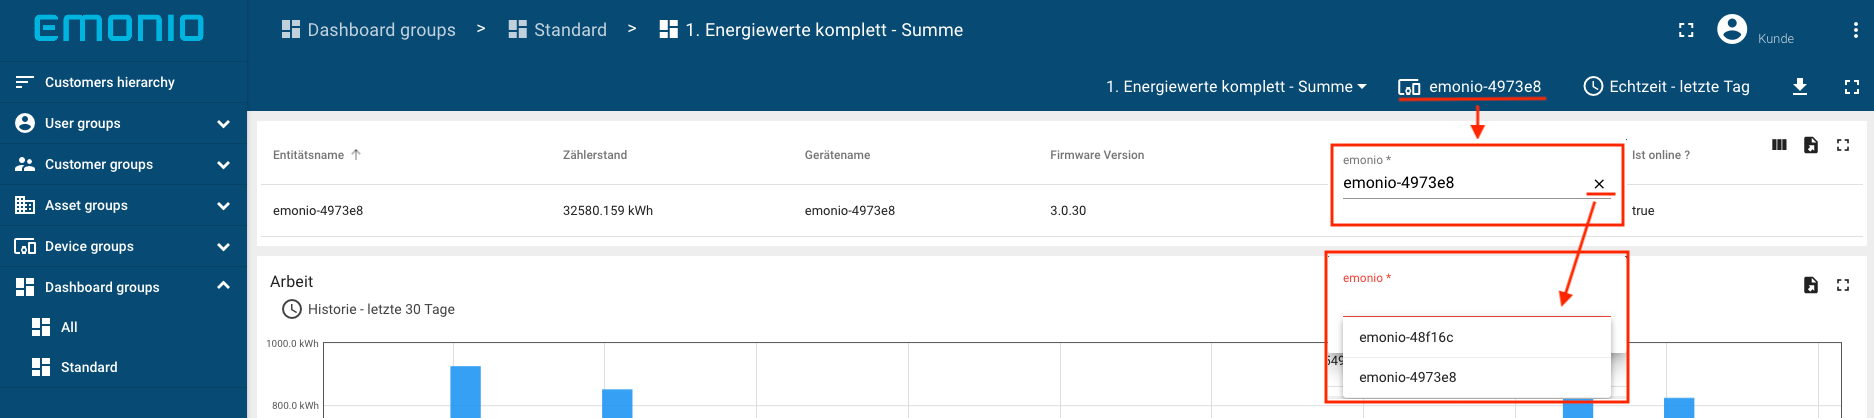
¶ Entities (measuring device)
You can switch between your entities using the entity selector within the dashboard. In order to get a selection of the available entities, you have to remove the current entity in the entity selection (see image).
¶ Time Window Setting
You control all widgets in the dashboard by setting the time window in the dashboard. This excludes widgets that have widget-specific time slot settings.
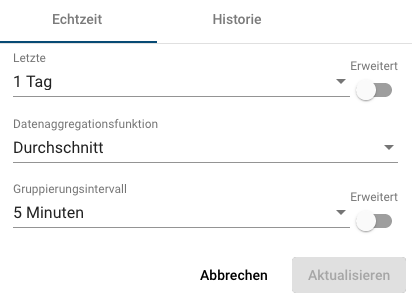
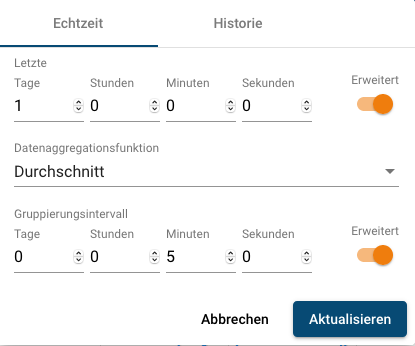
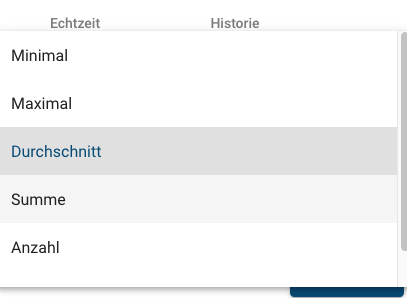
¶ Real Time Setting Options
| Real time settings | Advanced real time settings | Choice of data aggregation function |
 |
 |
 |
|
Example setting: 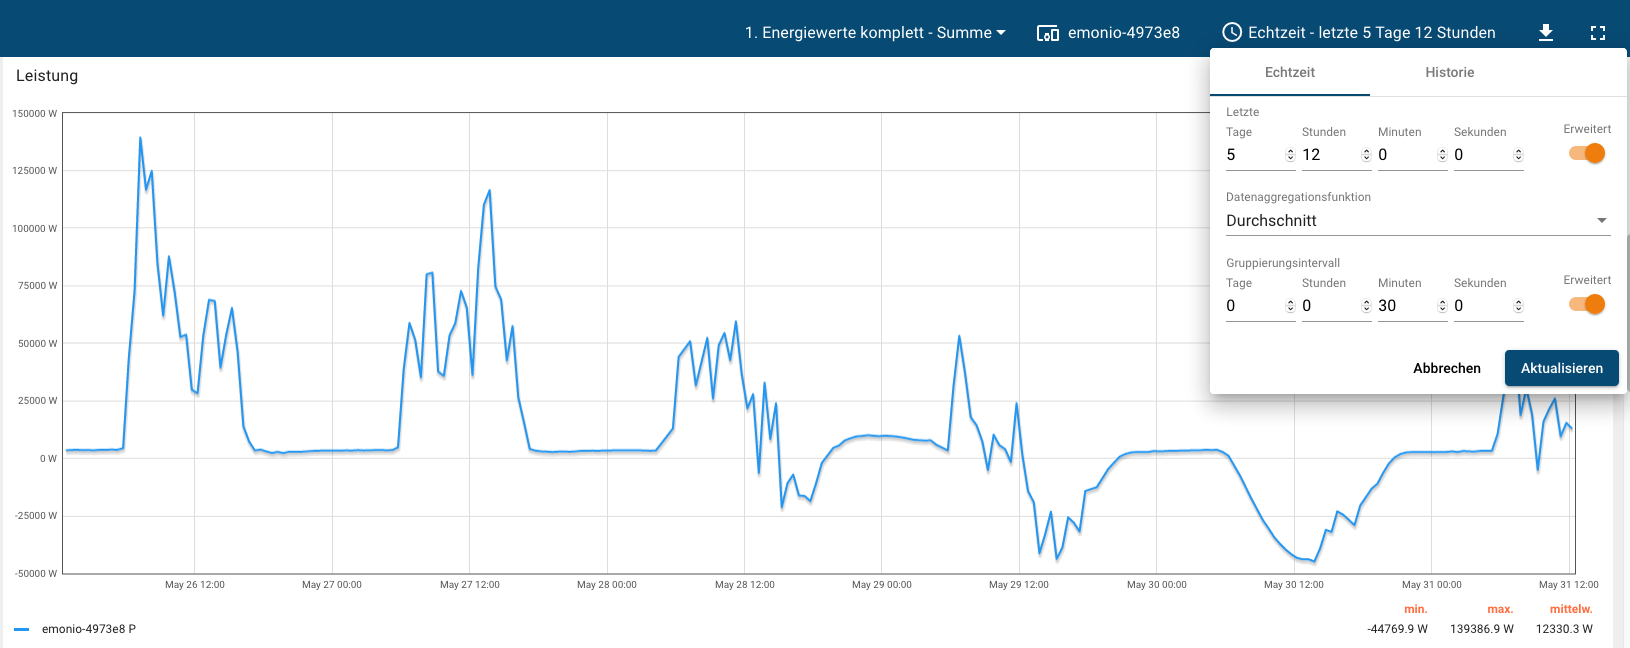 |
||
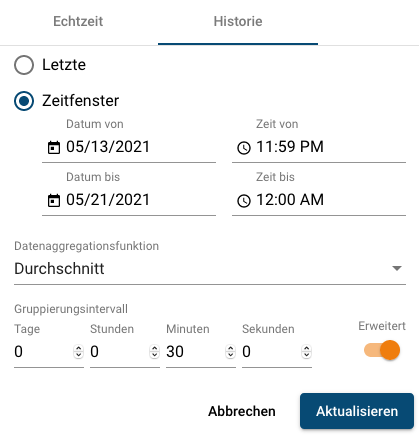
¶ History Setting Options
| History setting | Time slot selection |
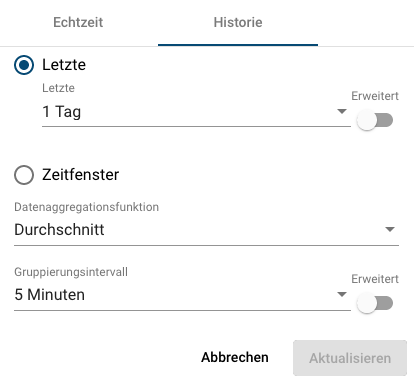 |
 |
|
Example setting: 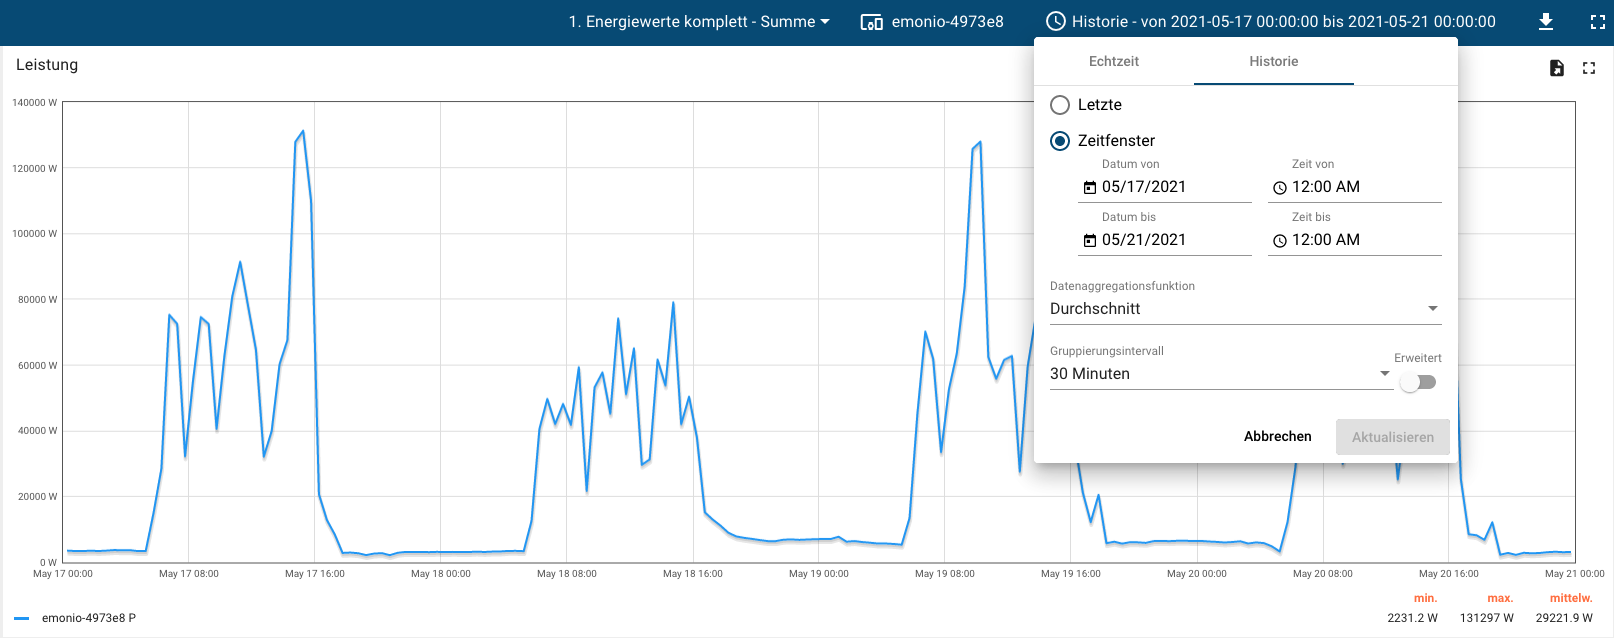 |
|
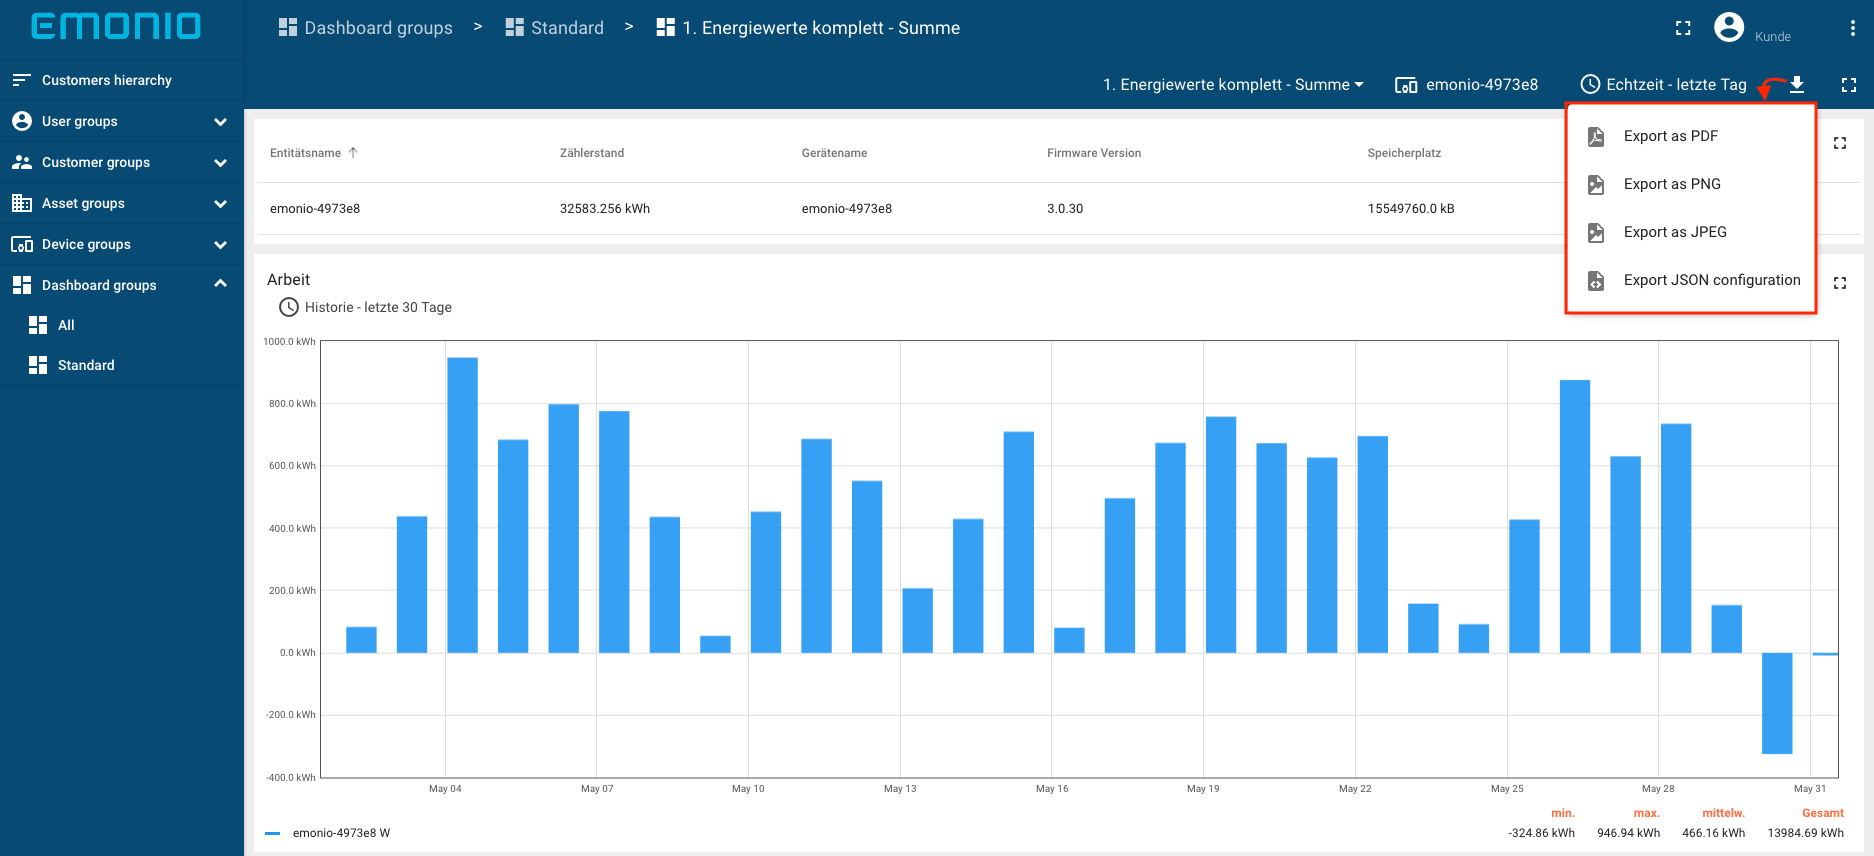
¶ Export
Use the export symbol (see image) to export your current dashboard in PDF, JPEG and PNG format.
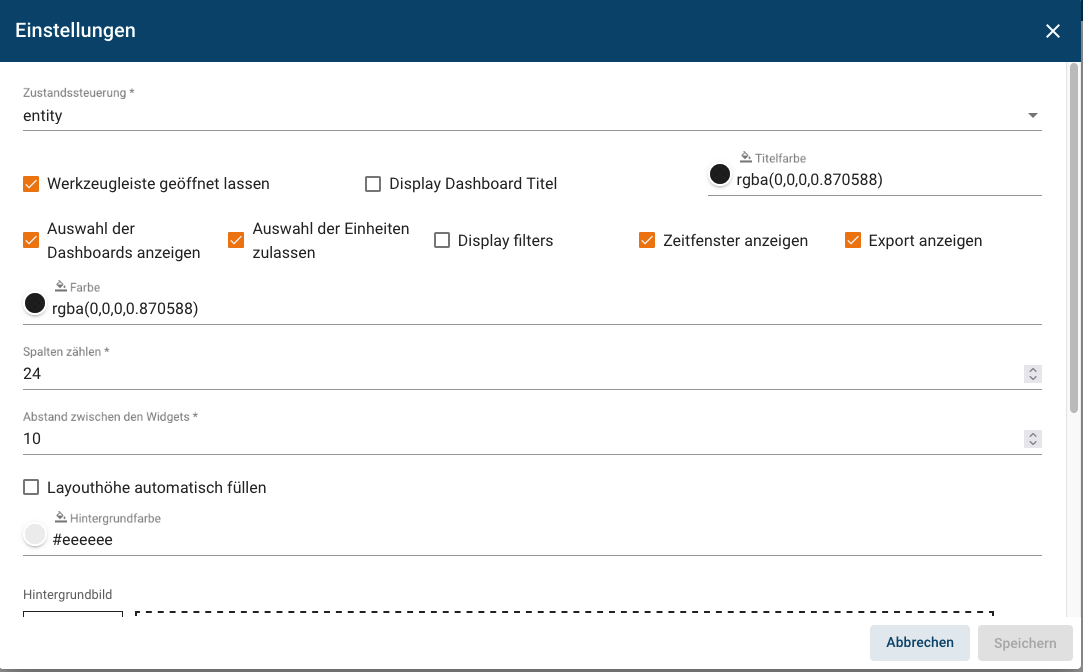
¶ Settings
The function icons in the header bar, such as the dashboard export function, can be shown or hidden in the dashboard settings. In addition, layout settings can be made here, with which you can design the dashboard according to your taste.
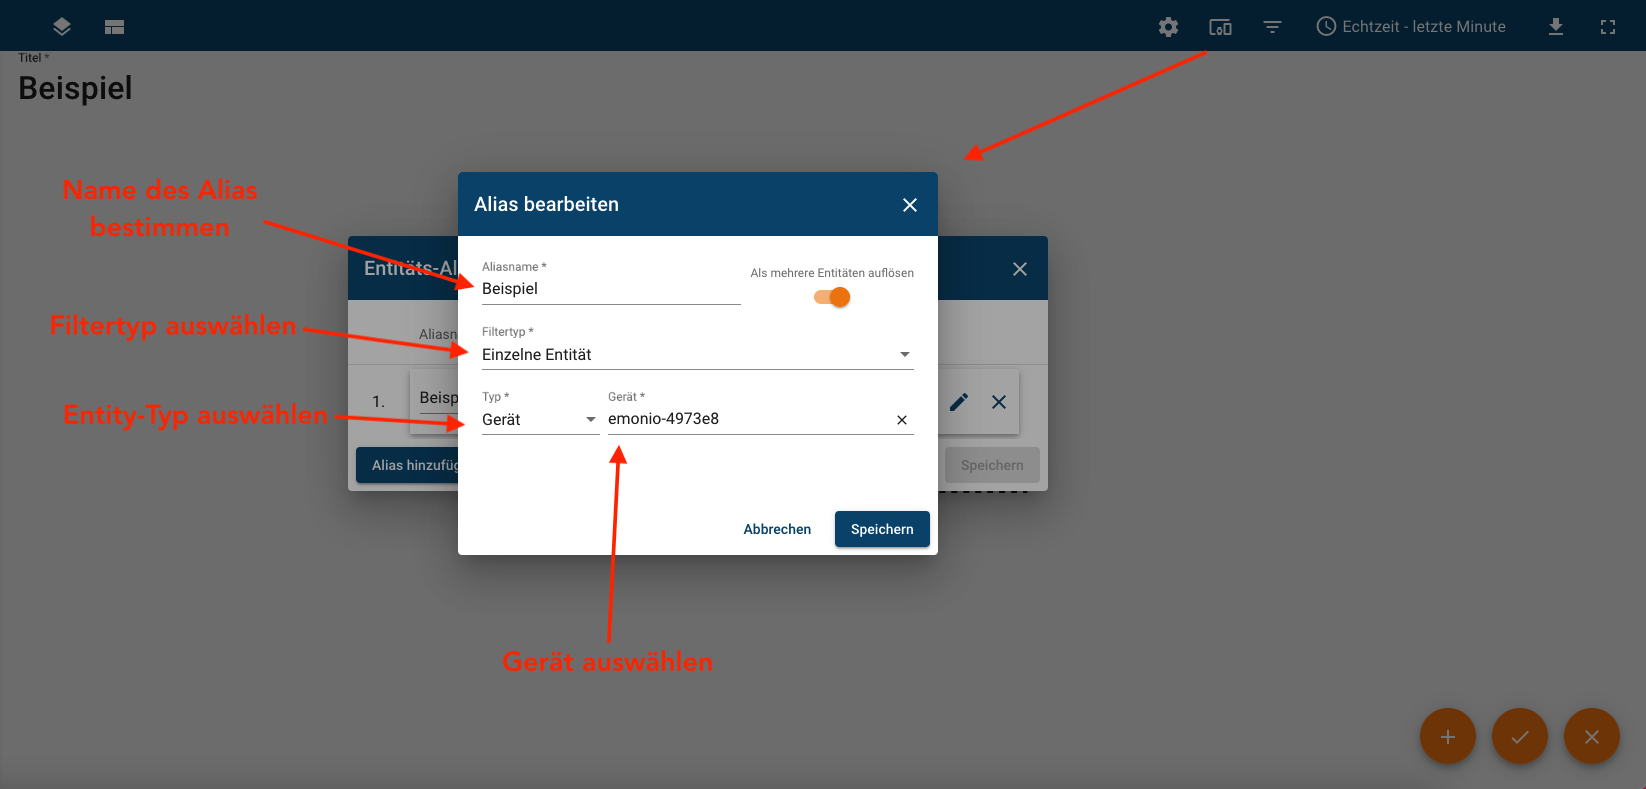
¶ Determine Entity
By creating one or more entities (devices, objects, etc.) you determine which data source(s) the dashboard refers to. Depending on the filter type, the options vary.
¶ Create overview dashboard
Individually designed dashboards provide an overview of your energy management. The structure of a sample dashboard is shown below. Useful and clear dashboards can be created based on the relationship structures created in the chapter Integration → Generation of data point list.
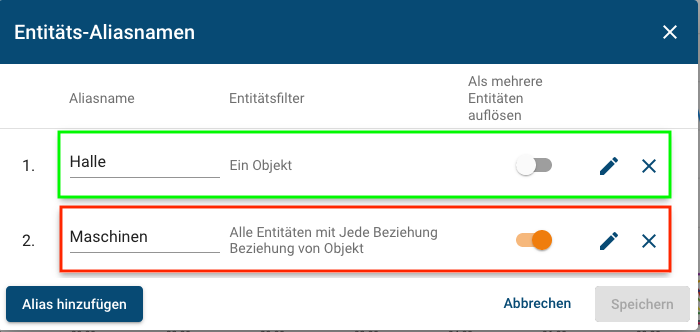
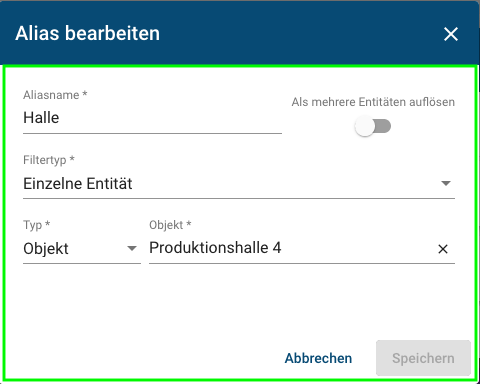
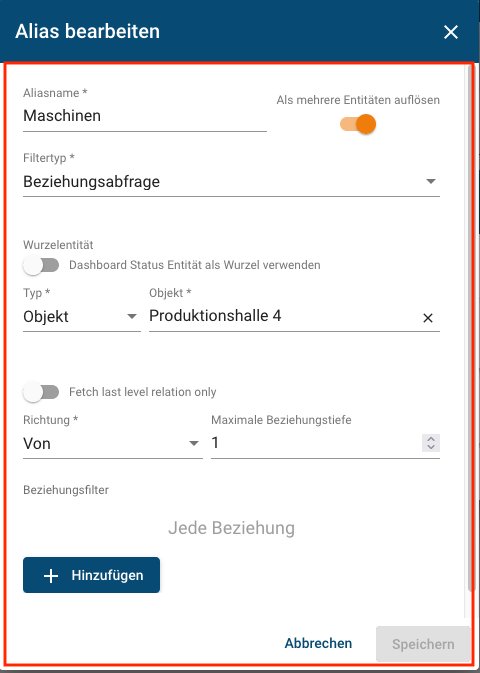
¶ Allocation of data sources
In our example we want to create an overview of production hall 4. For this we add a new dashboard (see Configure dashboard). Next, the associated data sources are determined by setting the entity alias names (see Creating an alias).
|
|
|
¶ Display and Evaluation via Widgets
In the picture below you can see the widgets of the production hall 4.
- Real-time performance plants production hall 4 + total production hall 4
- Current performance values systems production hall 4
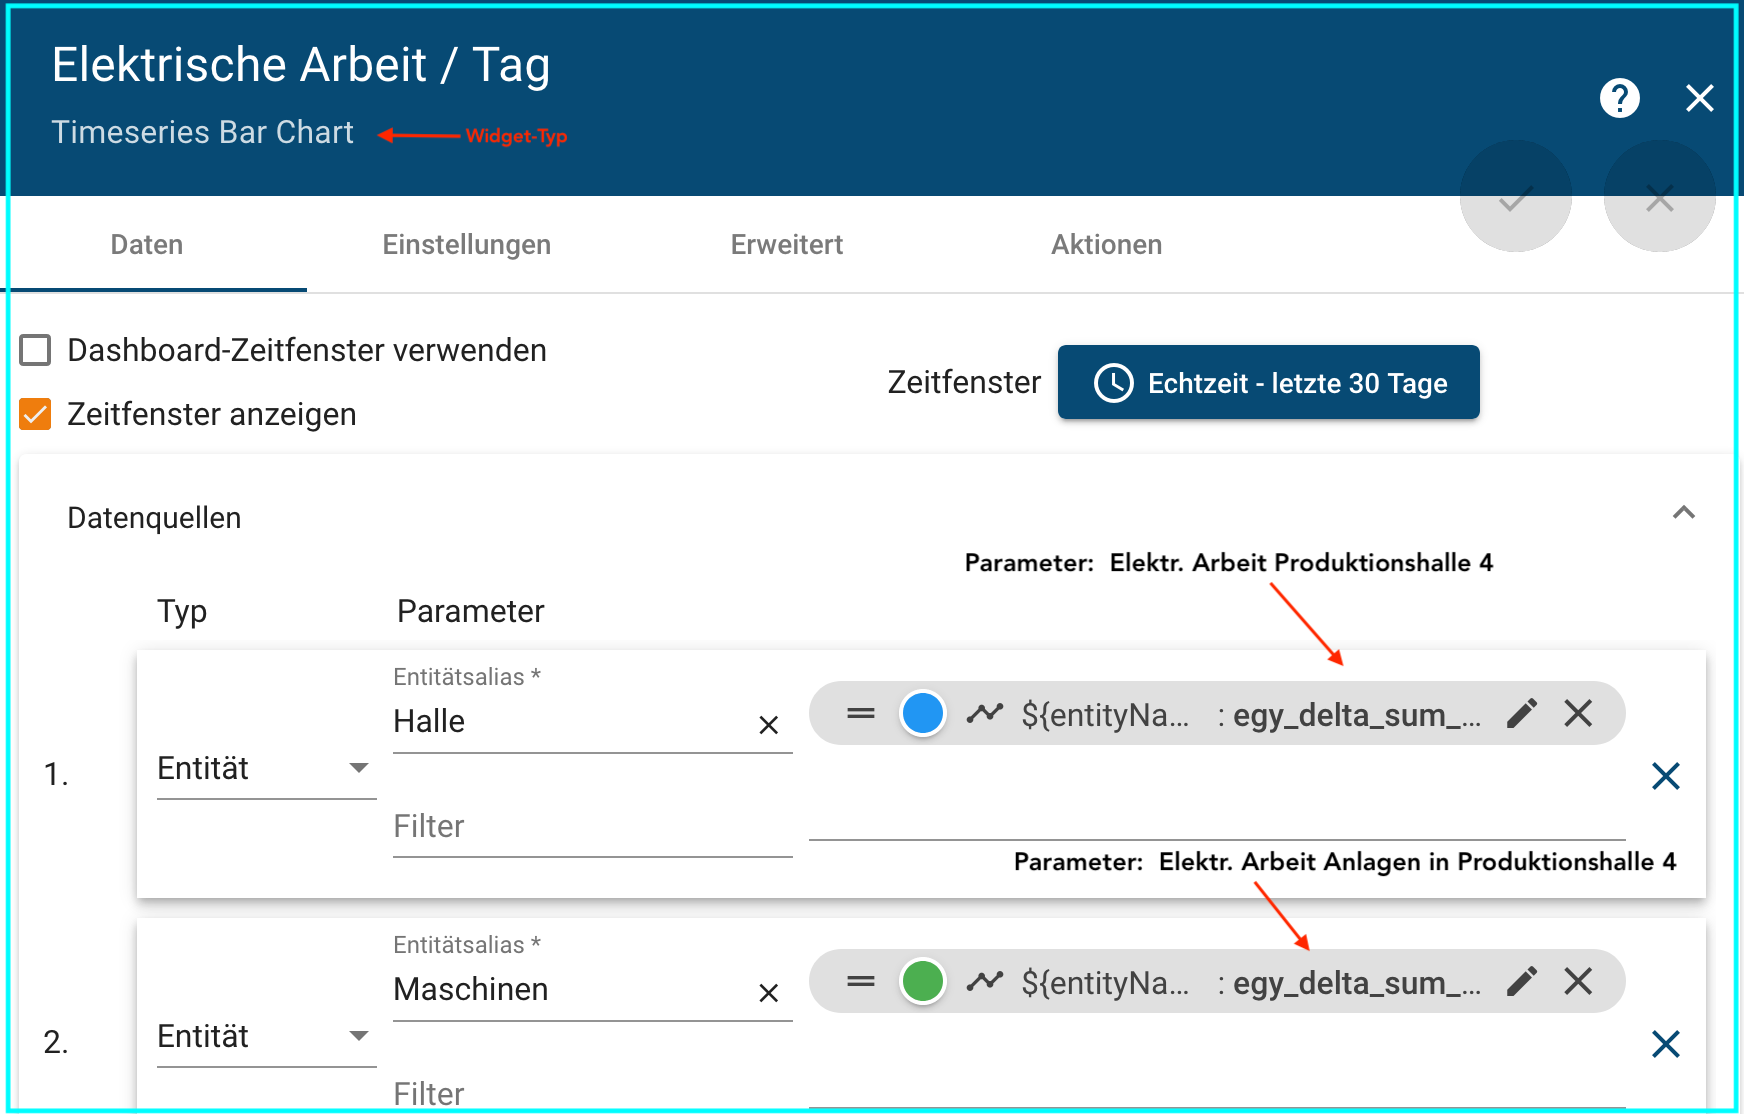
- Electrical work/day plants production hall 4 + total production hall 4
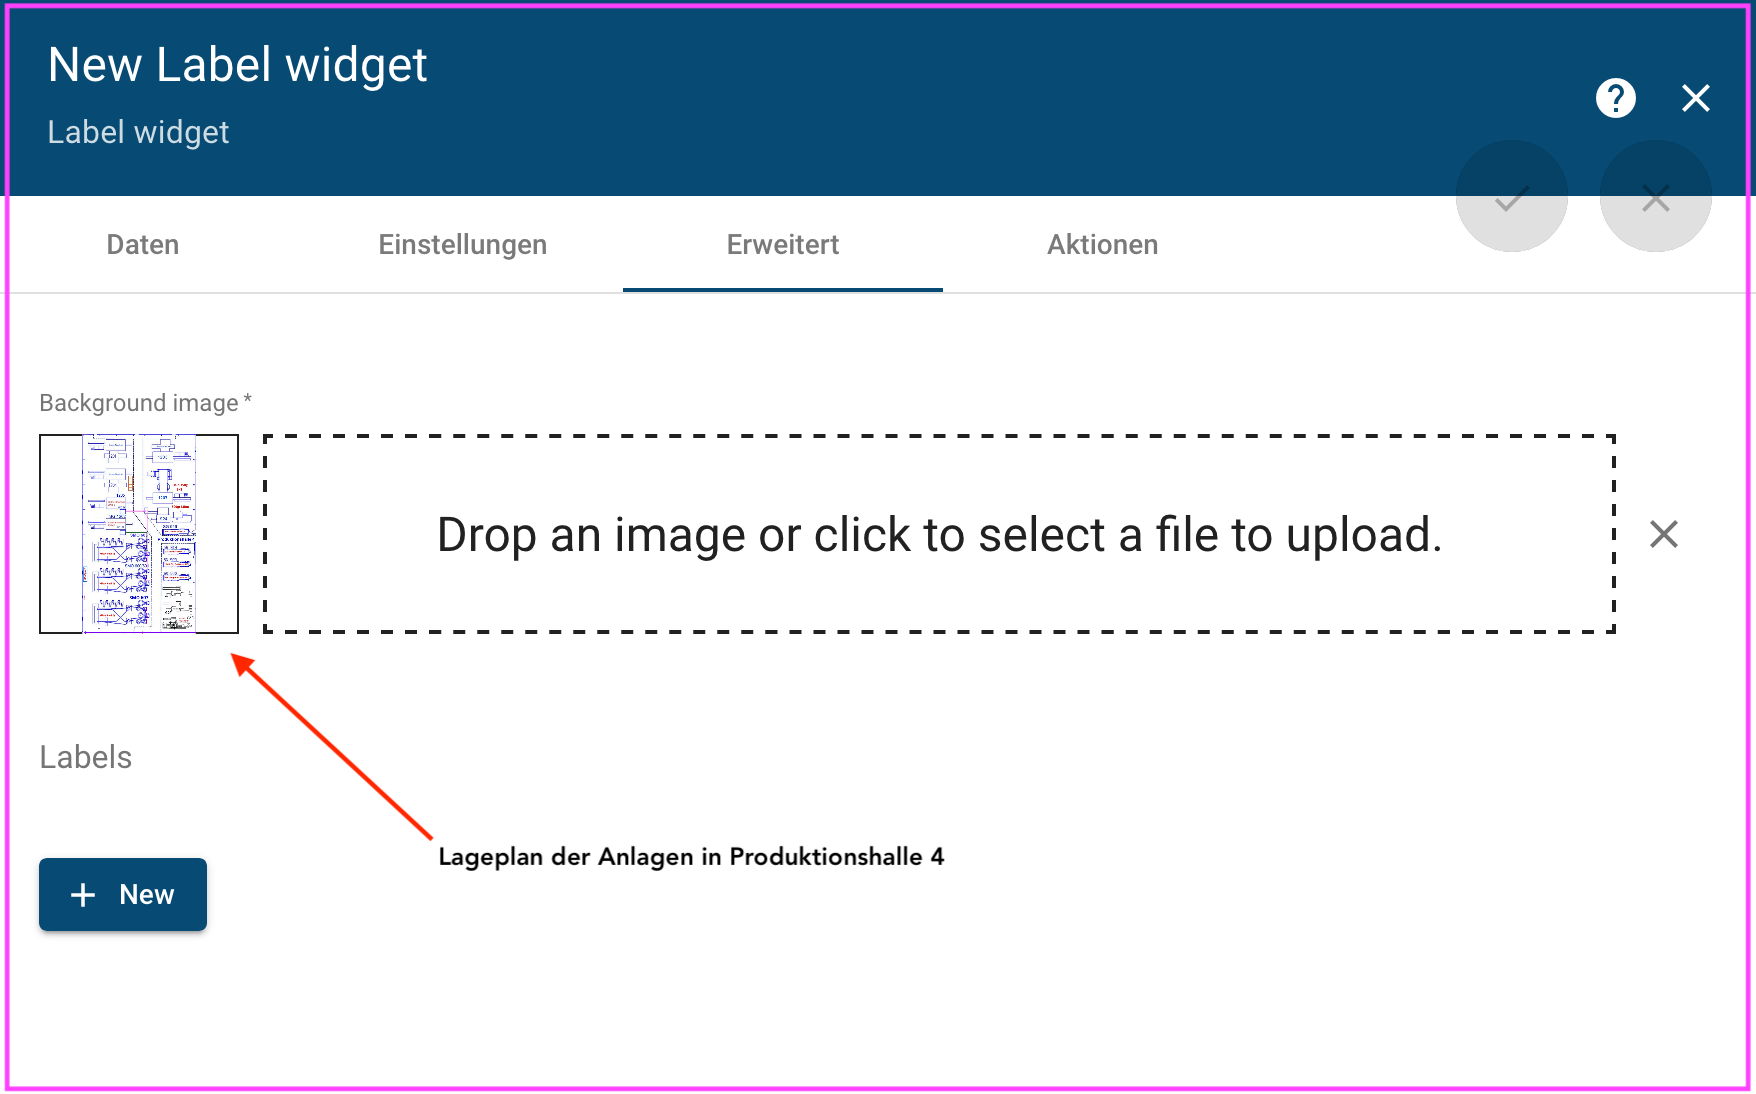
- Machine location plan production hall 4
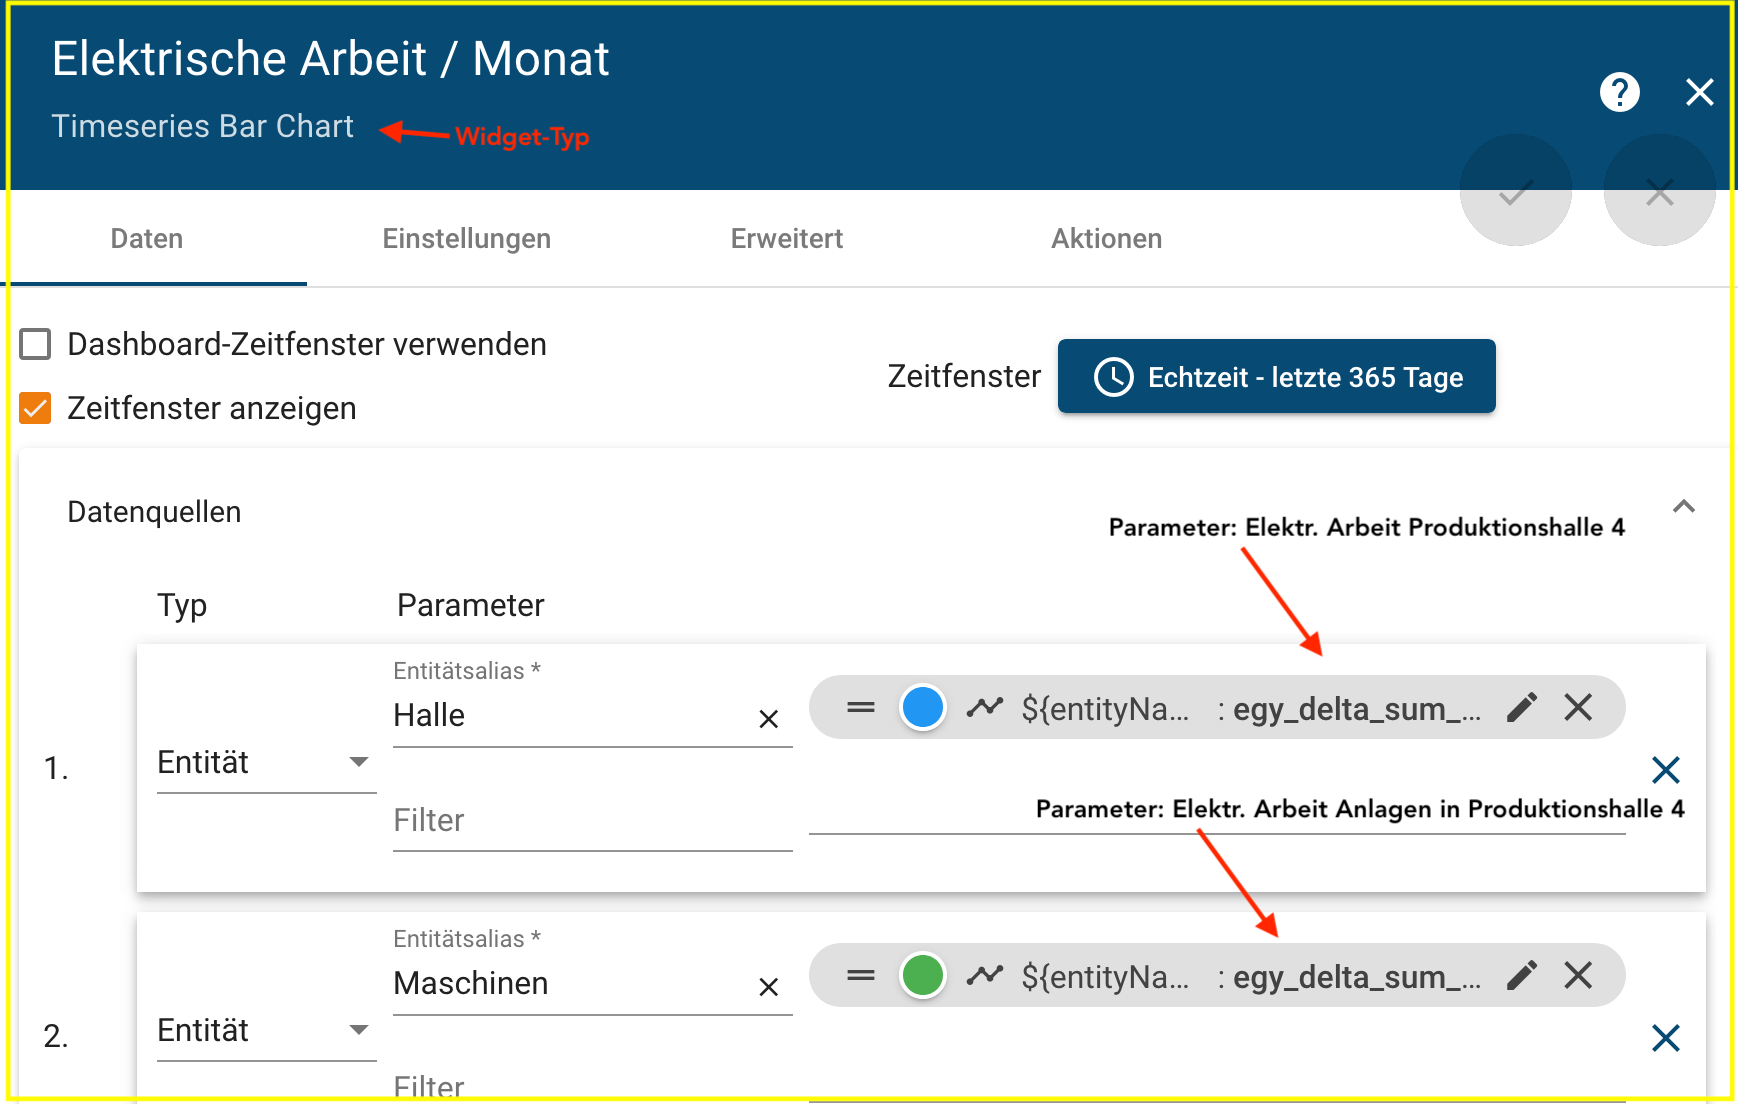
- Electrical work/ month plants production hall 4 + total production hall 4
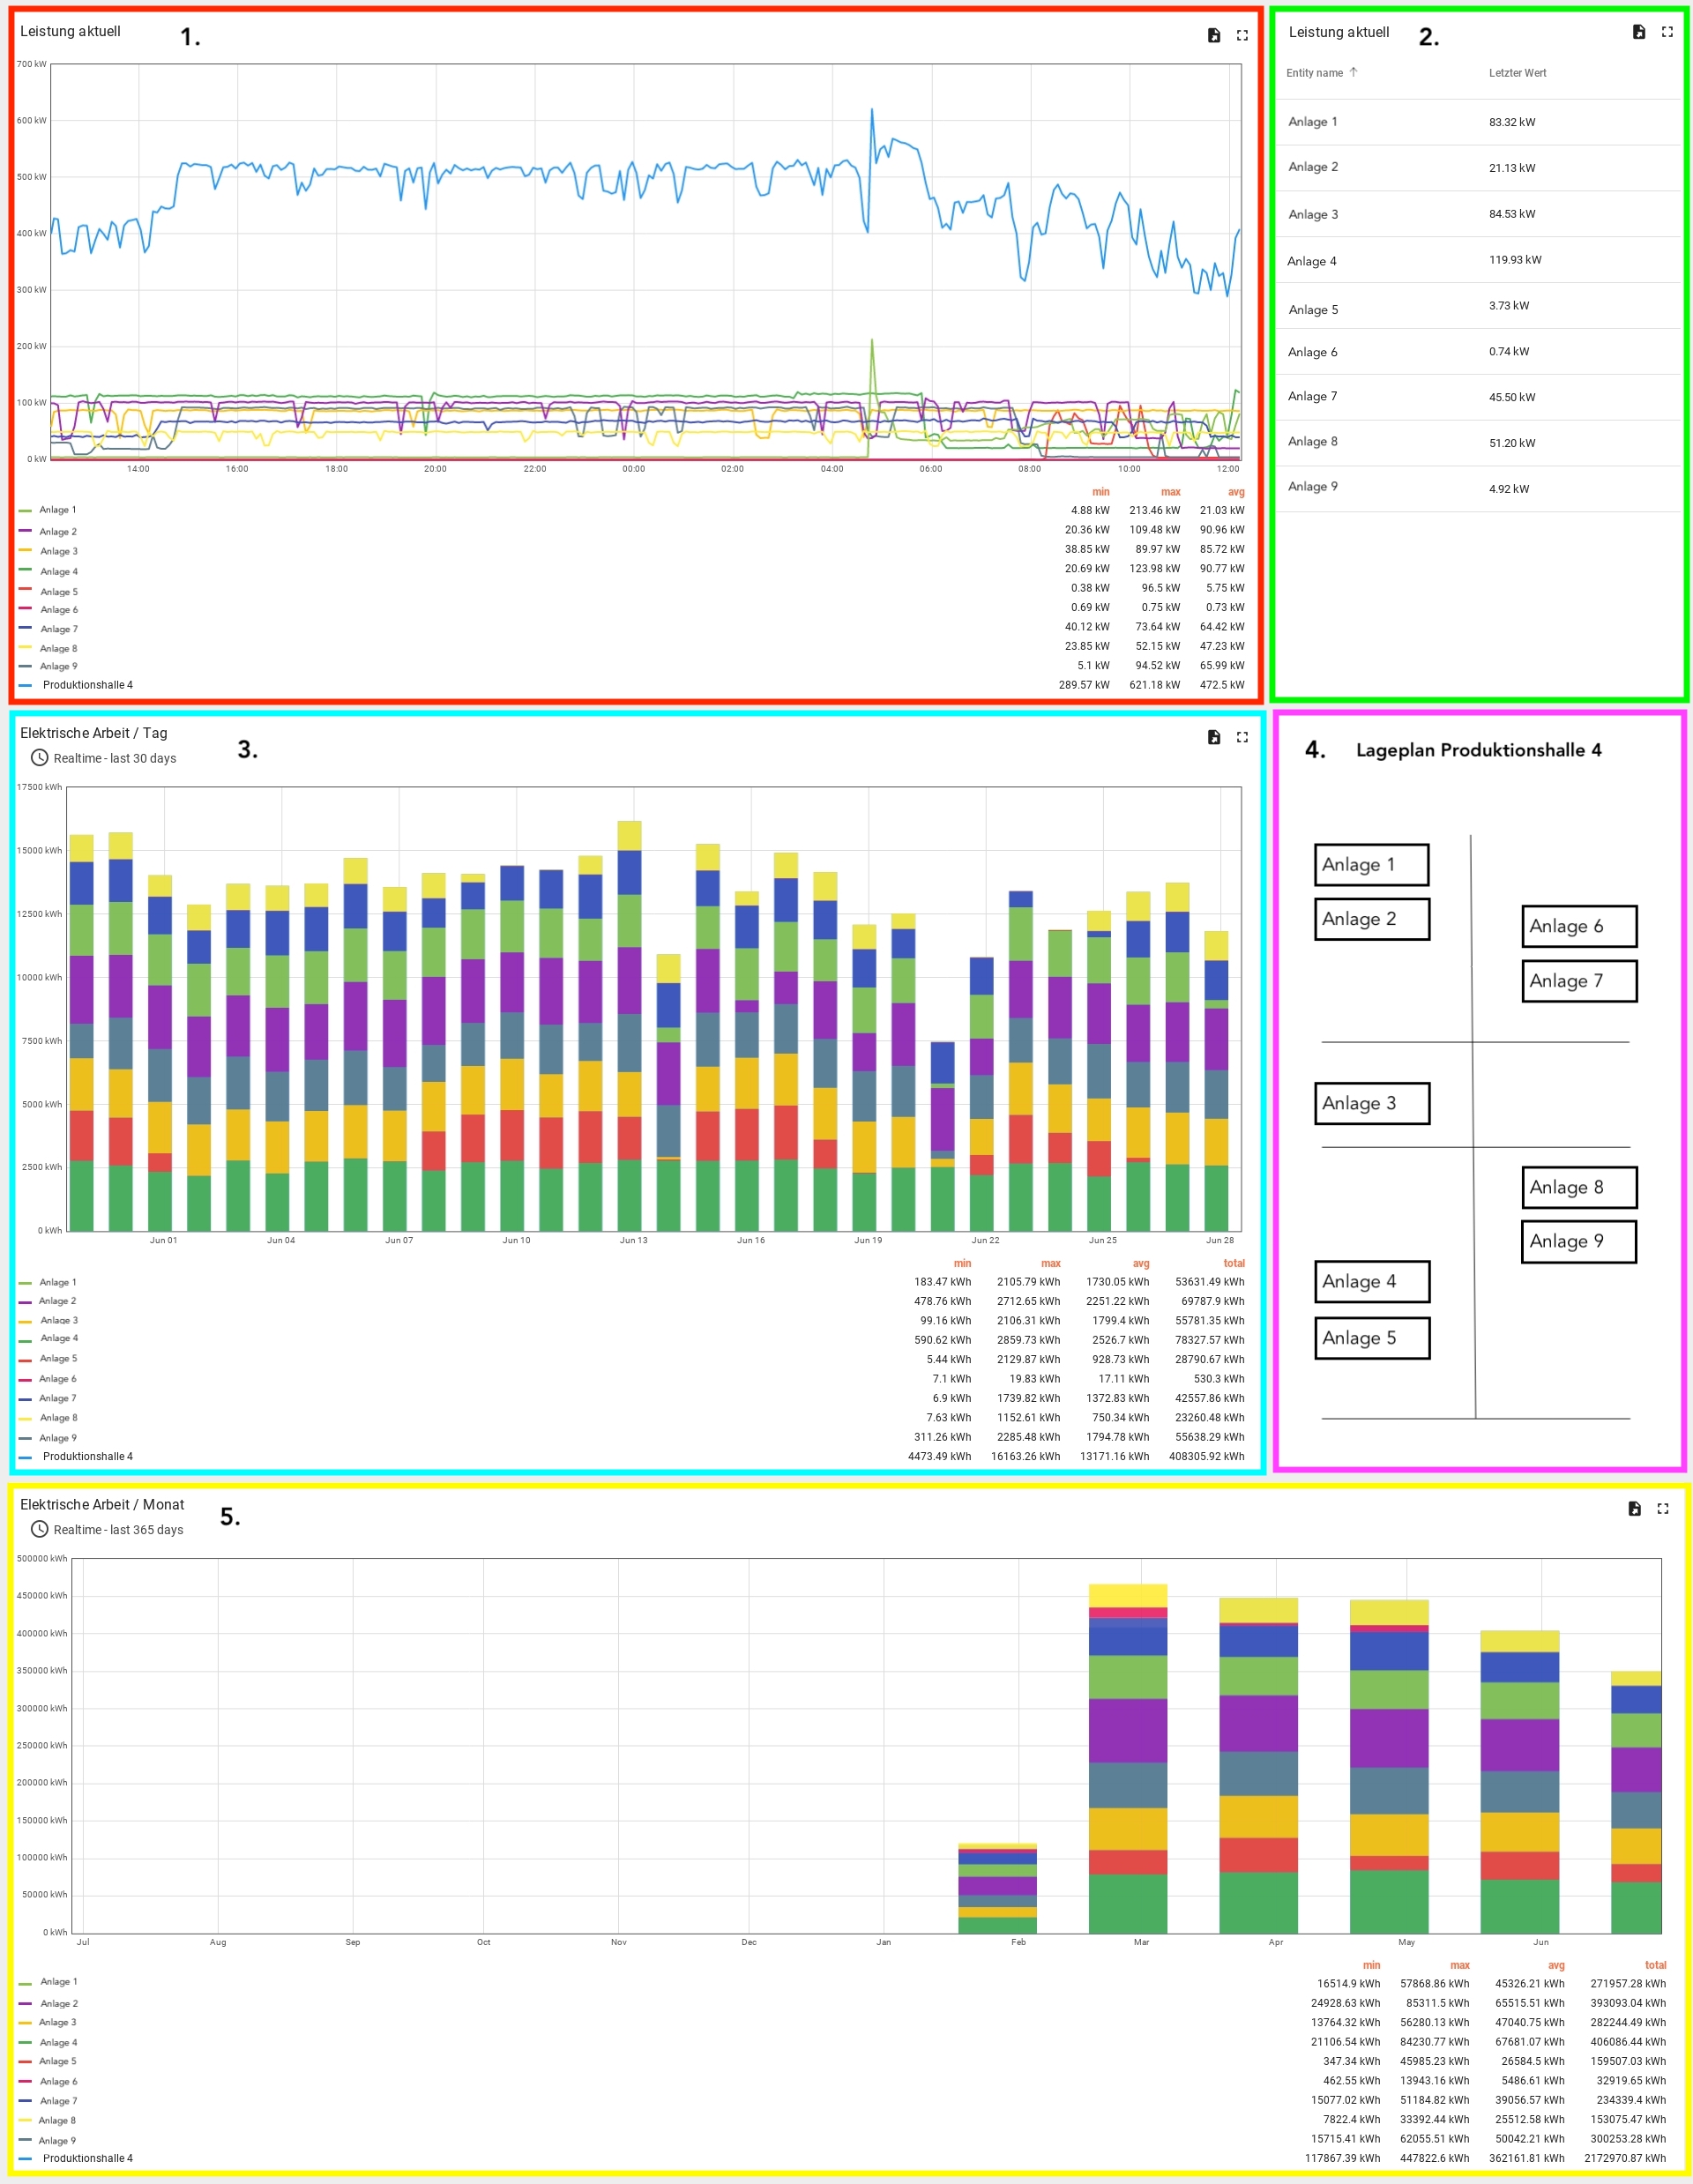
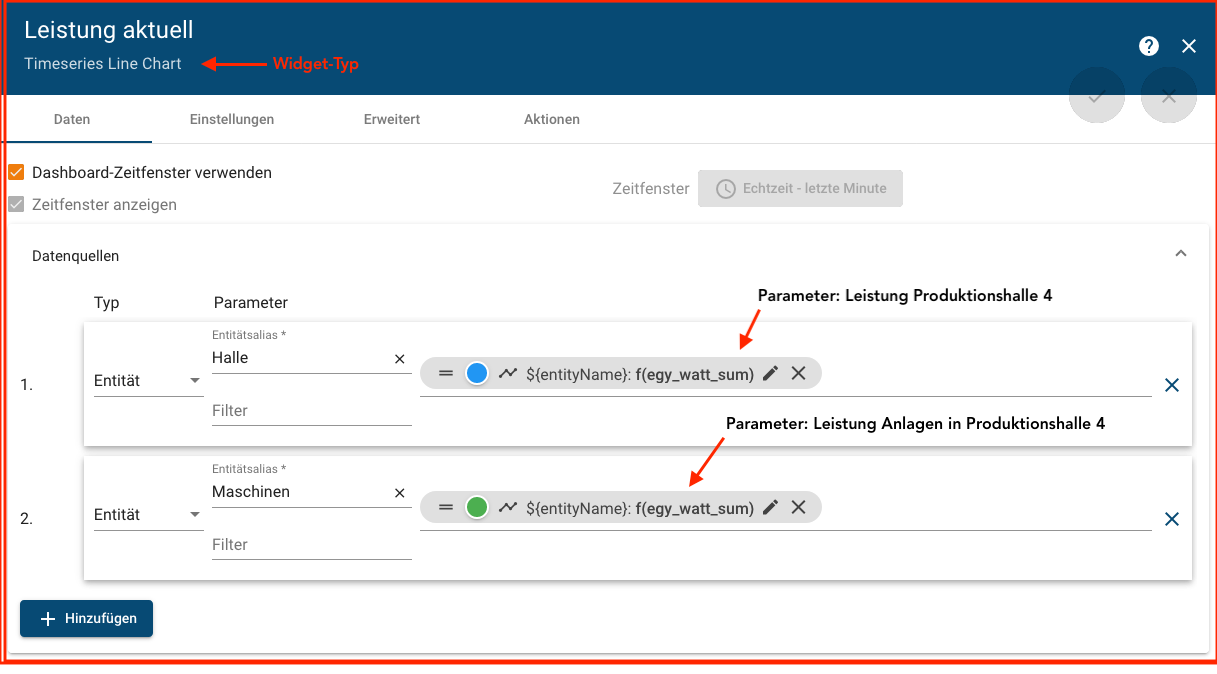
By assigning the data sources in the dashboard, the widgets can access these data sources. In the images below you can see the data source assignment of the widgets in production hall 4.
¶ 1. Real-time performance Plants Production Hall 4 + Total Production Hall 4
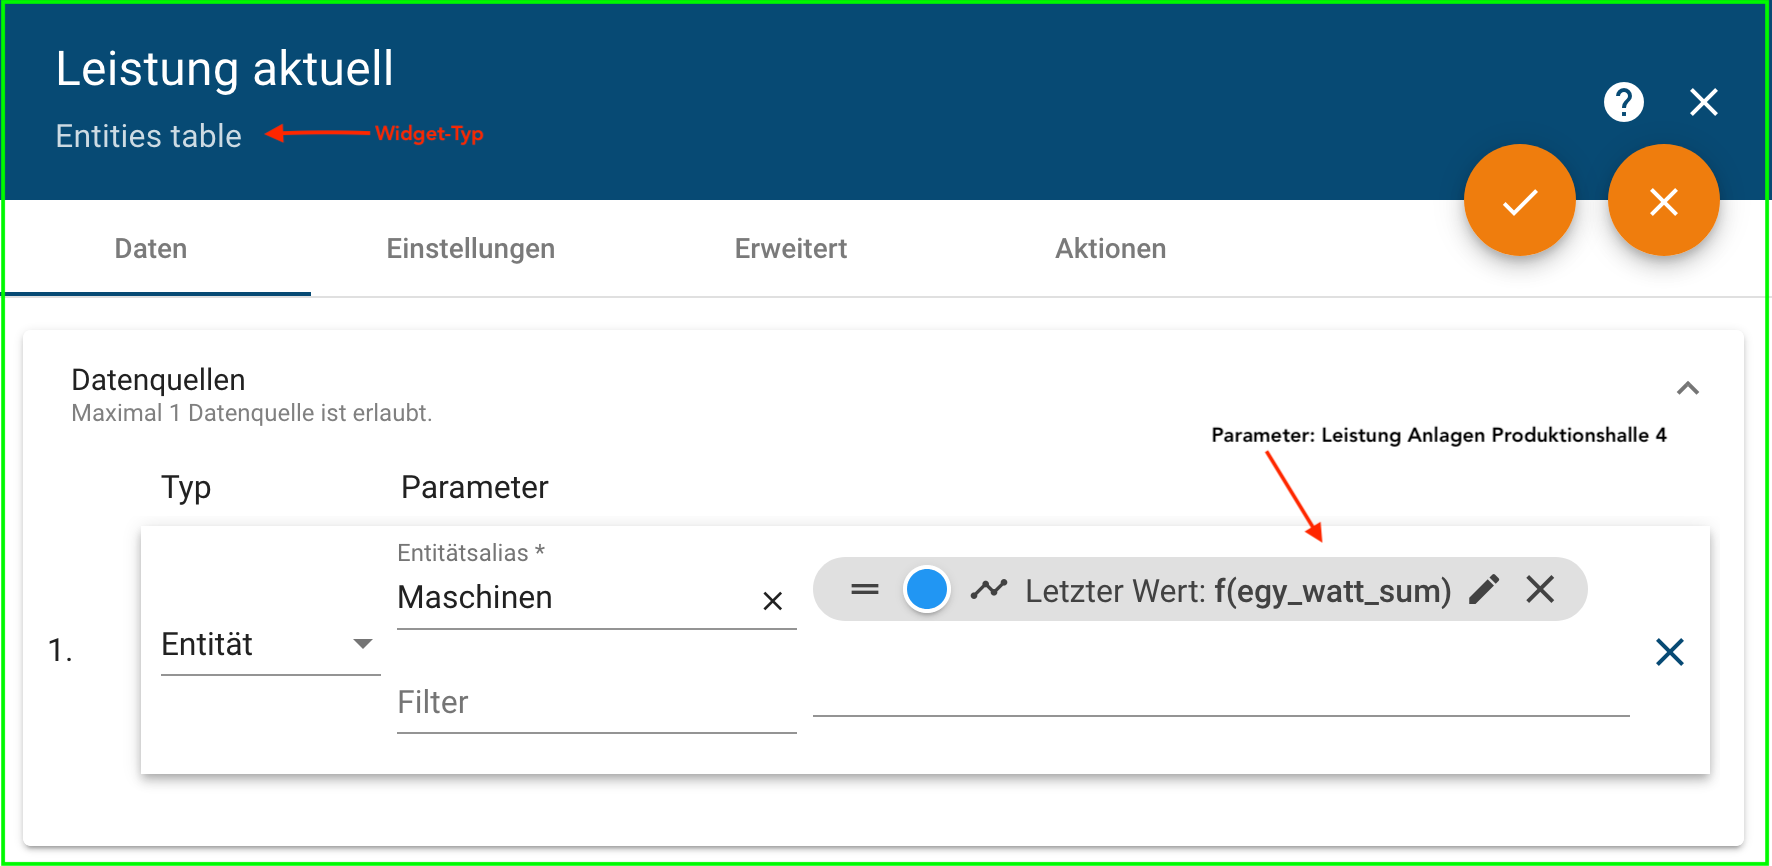
¶ 2. Current performance values systems production hall 4
¶ 3. Electrical work/day plants production hall 4 + total production hall 4
¶ 4. Machine location plan production hall 4
¶ 5. Electrical work/ month plants production hall 4 + total production hall 4