¶ Introduction
The Data export dashboard allows you to download data from a device that is stored on Pro Emonio.
This means that the data can also be analysed with other software or processed in other ways.
¶ Use of the data export dashboard
¶ Open dashboard
The dashboard can be found in the shared dashboard group Data management.
This is opened by clicking on Dashboards in the left-hand menu (1), then select the Shared tab (2) and click on the shared dashboard group Data management (3).
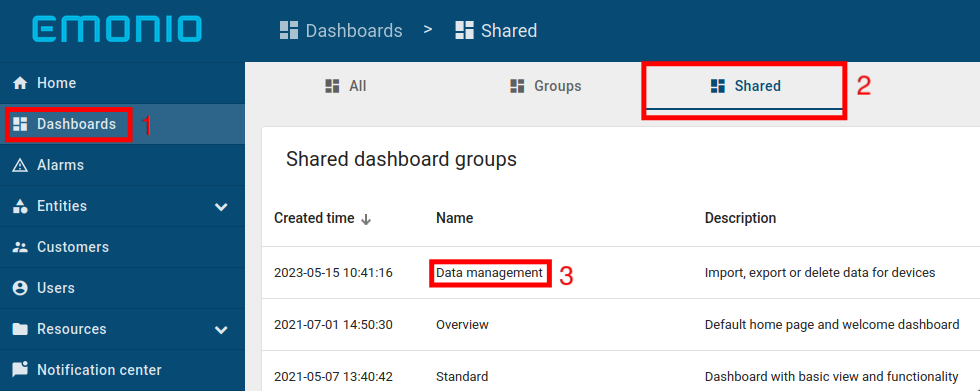
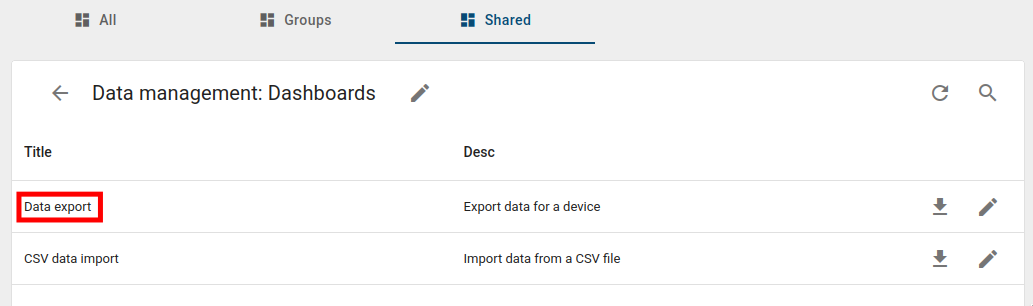
Select the Data export dashboard there.
¶ Select Emonio
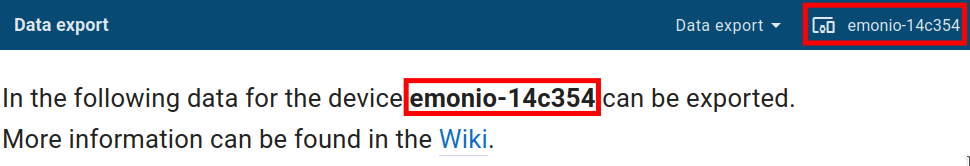
Once the dashboard has been opened, you must ensure that the correct Emonio has been selected for export.
The selected Emonio is displayed at the top right of the screen and is also mentioned in the text.
The Emonio can be changed by clicking on the name at the top right of the screen.
¶ Select time period
The first step is to select the period for which data is to be exported.
By clicking on the input fields, a selection option for date and time opens.
If the date is selected so that the start date (from) is after the end date (to), the entry is discarded and a warning is displayed.
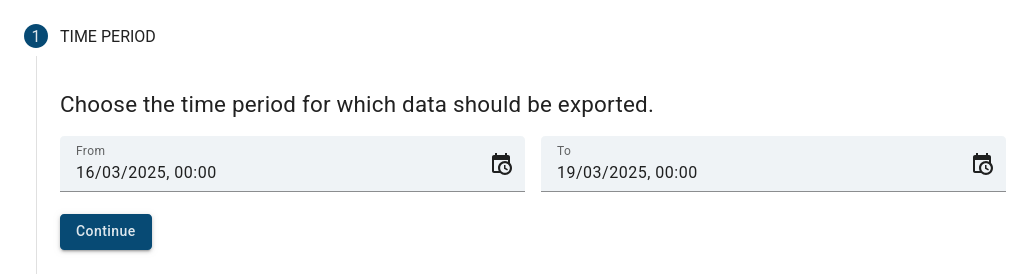
Click on Continue to navigate to the next step.
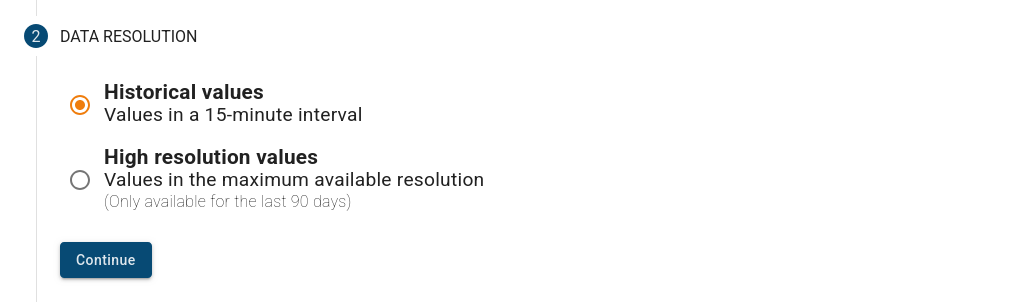
¶ Select data resolution
In the second step, the desired resolution of the data is selected. There are two options:
- Historical Values
With this option, values are exported at 15-minute intervals. These values correspond to the values that the Emonio transmits to Pro Emonio every 15 minutes.
A more detailed description can be found in the Emonio instructions in the section on the MQTT protocol.
As these values are stored on the server forever, the time period for this resolution can lie further in the past. - High resolution values
With this option, values are exported in the maximum possible resolution. This depends on the interval at which the Emonio transmitted data.
If the Emonio has sent data every second, second values are also exported. If the Emonio has transmitted data once a minute, one value packet per minute is exported.
As the high-resolution values are only stored on the server for 90 days, only the last 90 days can be exported.
If a start date more than 90 days in the past was selected when choosing the time period, the second option is deactivated.
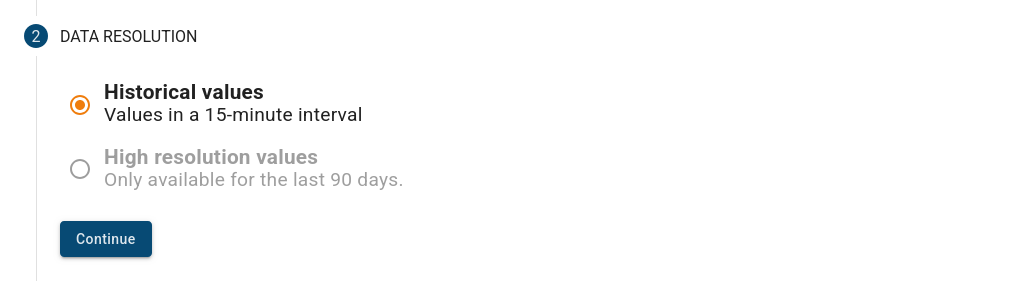
Click on Continue to navigate to the next step.
¶ Confirmation
In the third step, the selected parameters are listed for confirmation.
Click on Export now to start the actual export and navigate to the next step.

¶ Download
The progress of the export is displayed in the fourth step.
In the background, the data is downloaded from the server and written to a local CSV file.
Depending on the browser used, a window may open asking where the file should be saved.

During the export, the page must not be closed or navigated to another area within the page. Otherwise the export will be cancelled.
¶ Export finished
The fifth step is automatically displayed after the successful export.

¶ Error messages
¶ Export failed
If an error occurs during data export, this will be displayed in the fifth step. The error message is shown below. In most cases, it is sufficient to reload the page and perform the export again.
It is known that export is not possible if the page is opened in a private Firefox window or if the page has been reloaded with a full reload (Ctrl+Shift+R).

¶ Notes
¶ Empty fields in the file
When exporting data, the CSV file may contain empty fields. This occurs when no data is available for the respective value at the given time.
This occurs primarily with values such as the pulse counter (cnt_) or harmonics (hrm_).
The pulse counter value is only transmitted when it changes and the harmonics only when they exceed the set threshold value, which can result in gaps.
¶ Unrealistic values
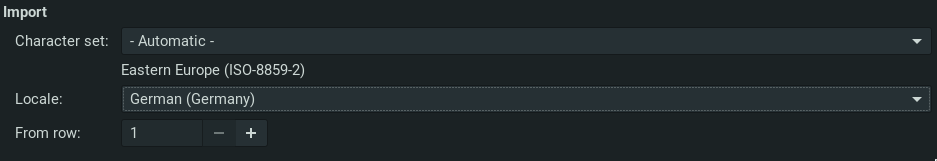
If the exported file is opened and displays unrealistically large values, this is usually due to the language settings.
For example, if the browser is set to German, a comma is used as the decimal separator. If the file is then opened in a spreadsheet programme set to English, the comma is interpreted as a thousand separator. This can result in numbers that are significantly higher and out of line. This can be seen in the image.
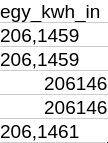
To get around this problem, make sure that the correct language is selected when opening the file.
The following option is available when opening the file in LibreOffice.