¶ Output of mathematical Quantities
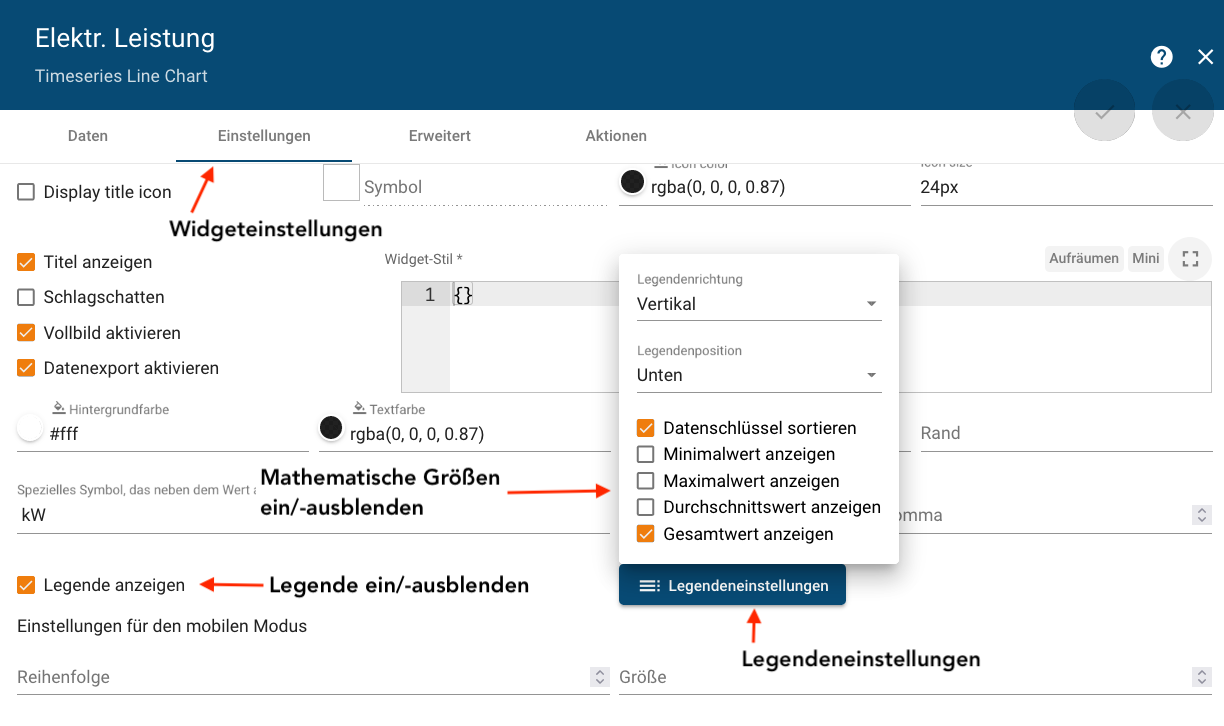
The mathematical quantities are output via diagram widgets. The settings for the widgets contain the legend settings, which you can use to show and hide the mathematical variables sum, mean, minimum and maximum value.
¶ Total Sums
|
In the legend settings, enable “Show totals” to show the totals in the legend. . 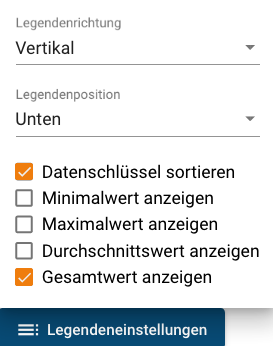 |
|
Select the desired observation period. The totals of the individual data keys for the period under consideration are displayed in the legend. 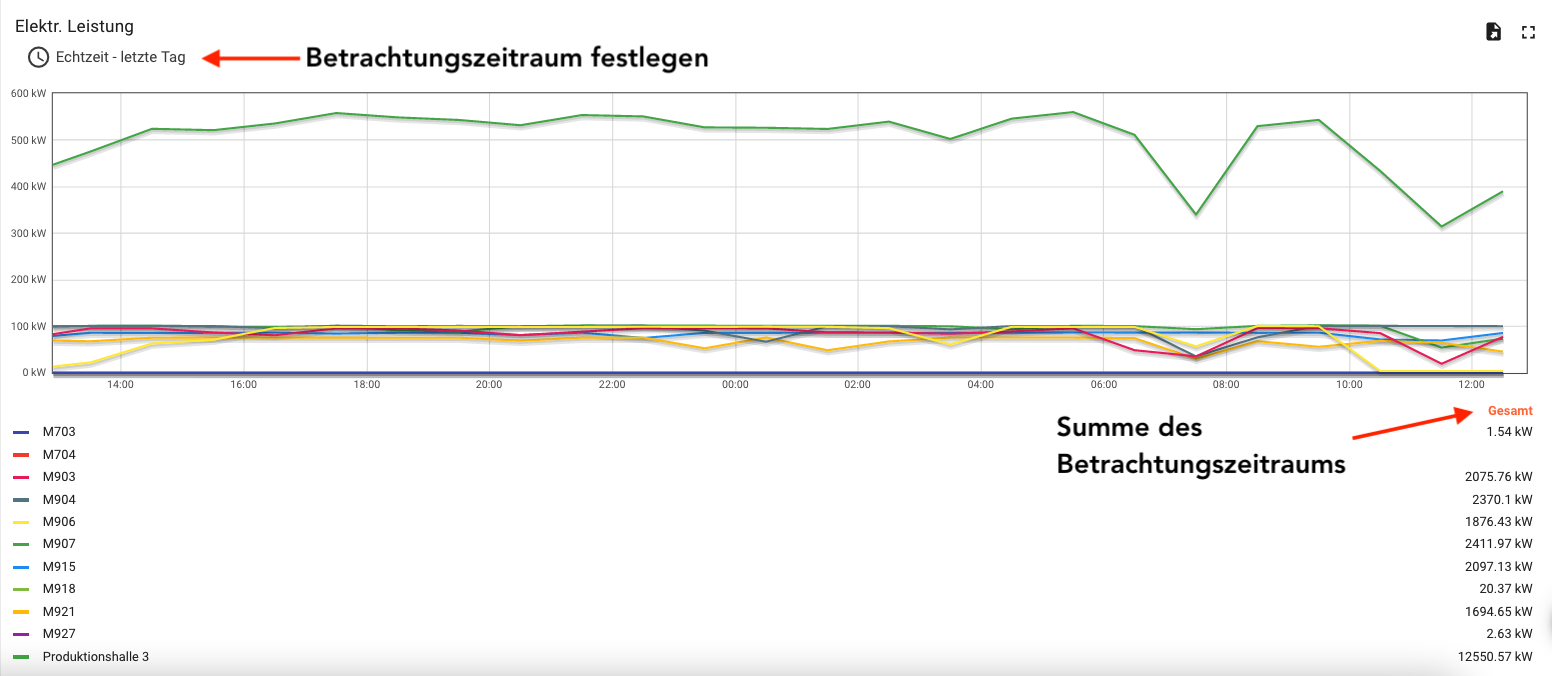 |
¶ Average Values
|
Activate “Show average value” in the legend settings to display the average values in the legend. 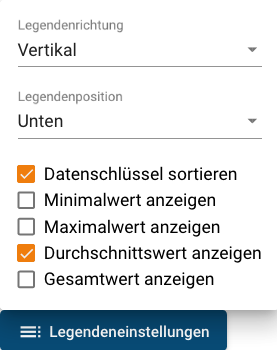 |
|
Select the desired observation period. The legend shows the average values of the individual data keys for the period under consideration. 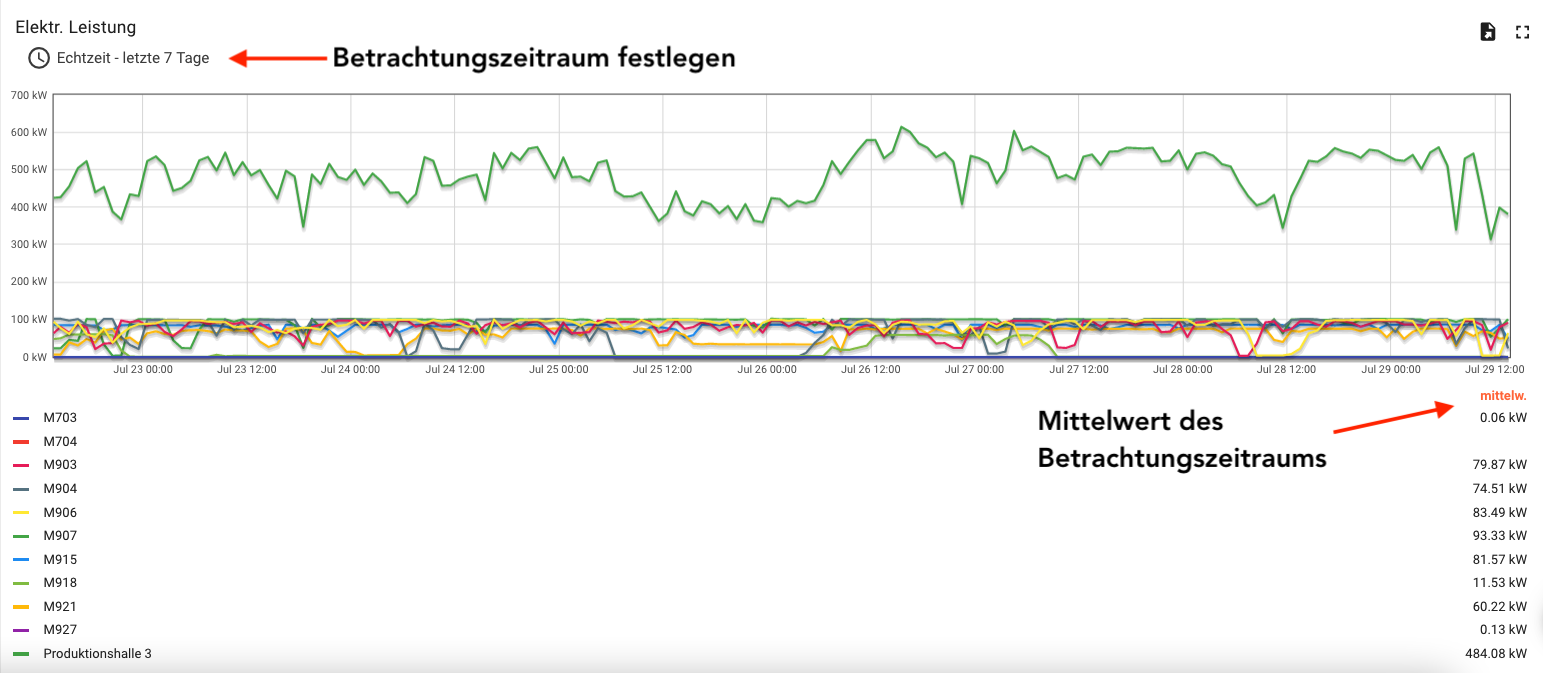 |
¶ Extreme Values
|
Activate “Show minimum and maximum values” in the legend settings to display the totals in the legend. 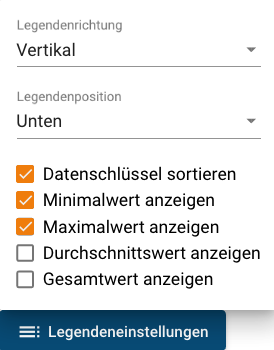 |
|
Select the desired observation period. The mean values of the individual data keys for the period under consideration are displayed in the legend. 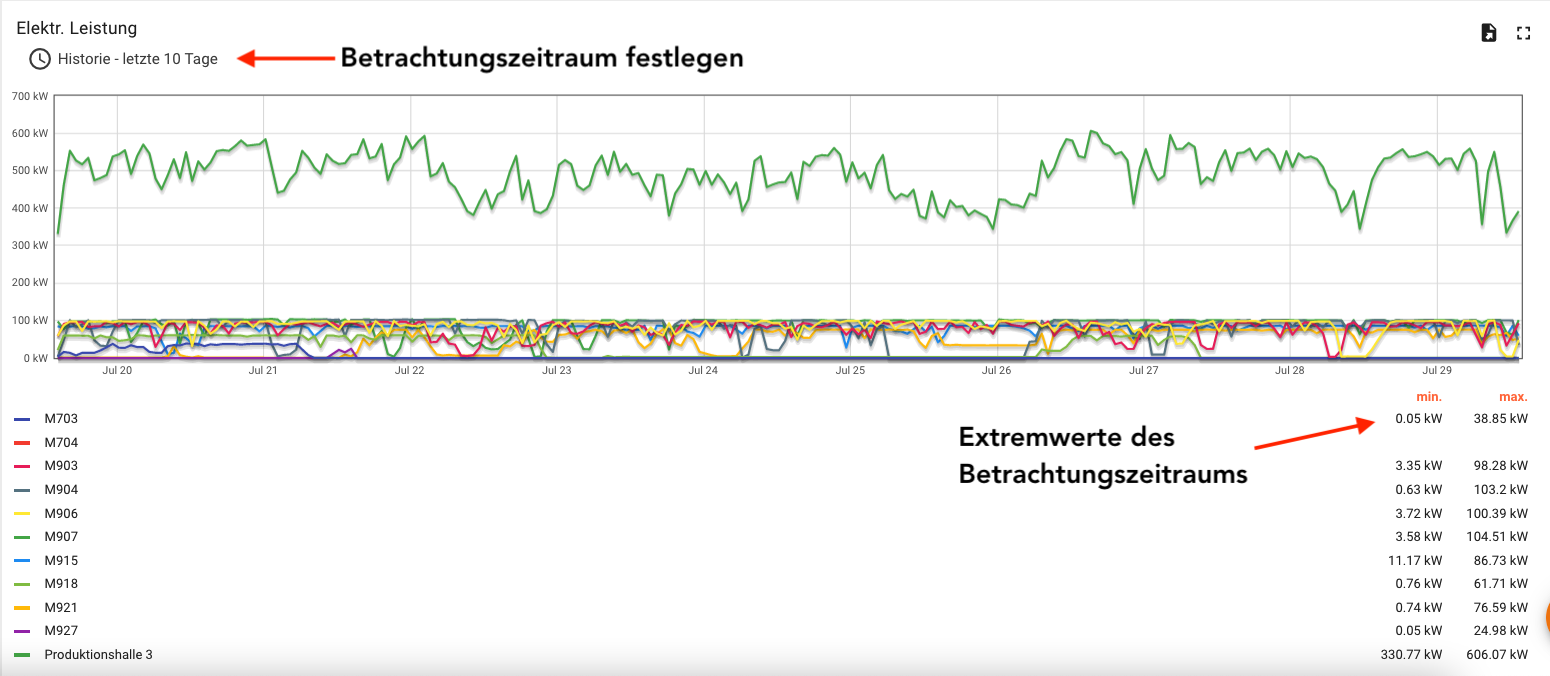 |
¶ Formation of Key Figures
Objects and their properties are used to form key figures. You can find more information on the subject of objects in the chapter Objects.
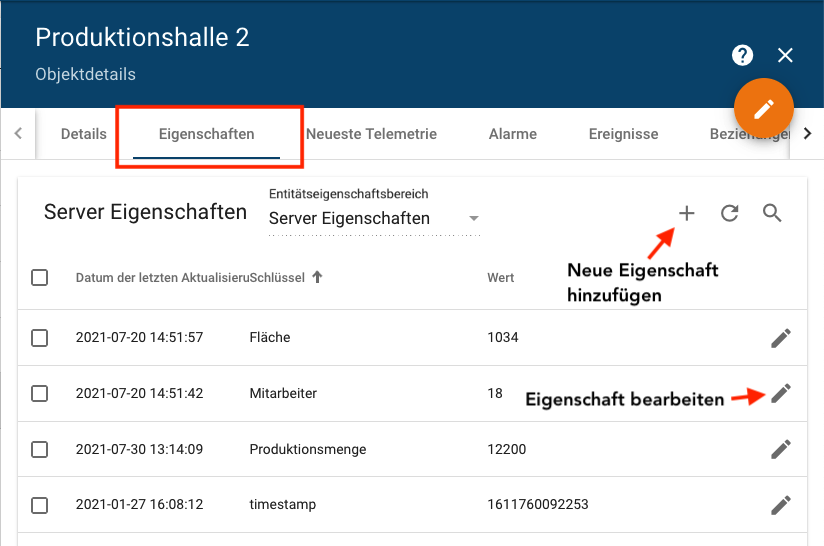
Add the properties from which you want to build your key figures to the appropriate objects. Switch to the object menu and select the object in which the properties are to be created..
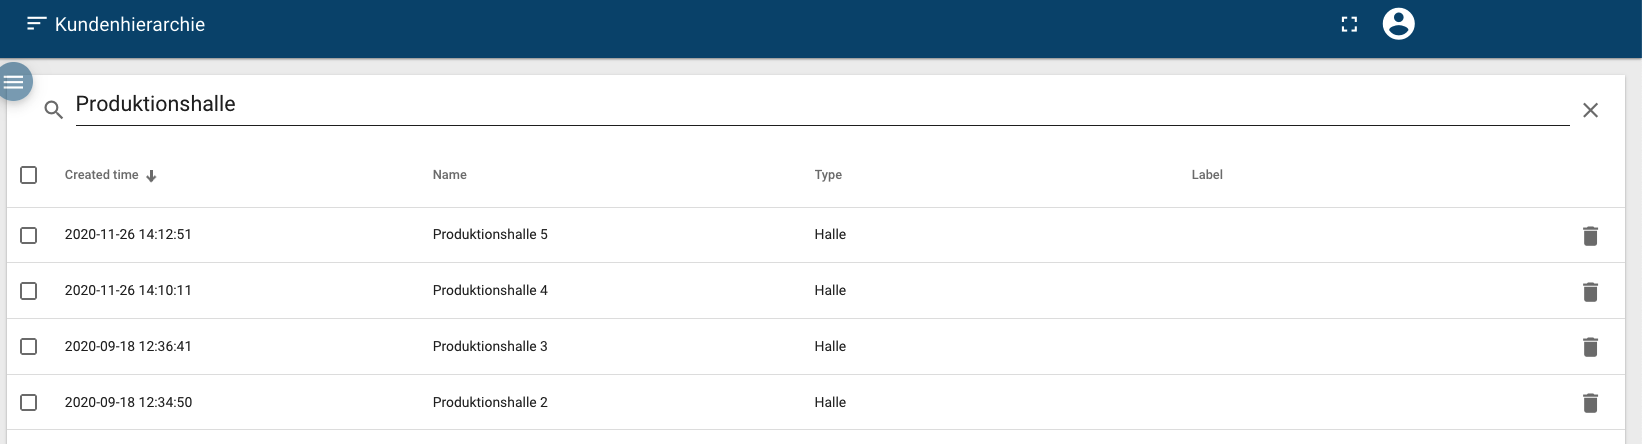
In the following example, the specific power consumption of the halls is formed per area and per product quantity. The area size and production quantity are added in the object details of the production hall 2-5 objects.
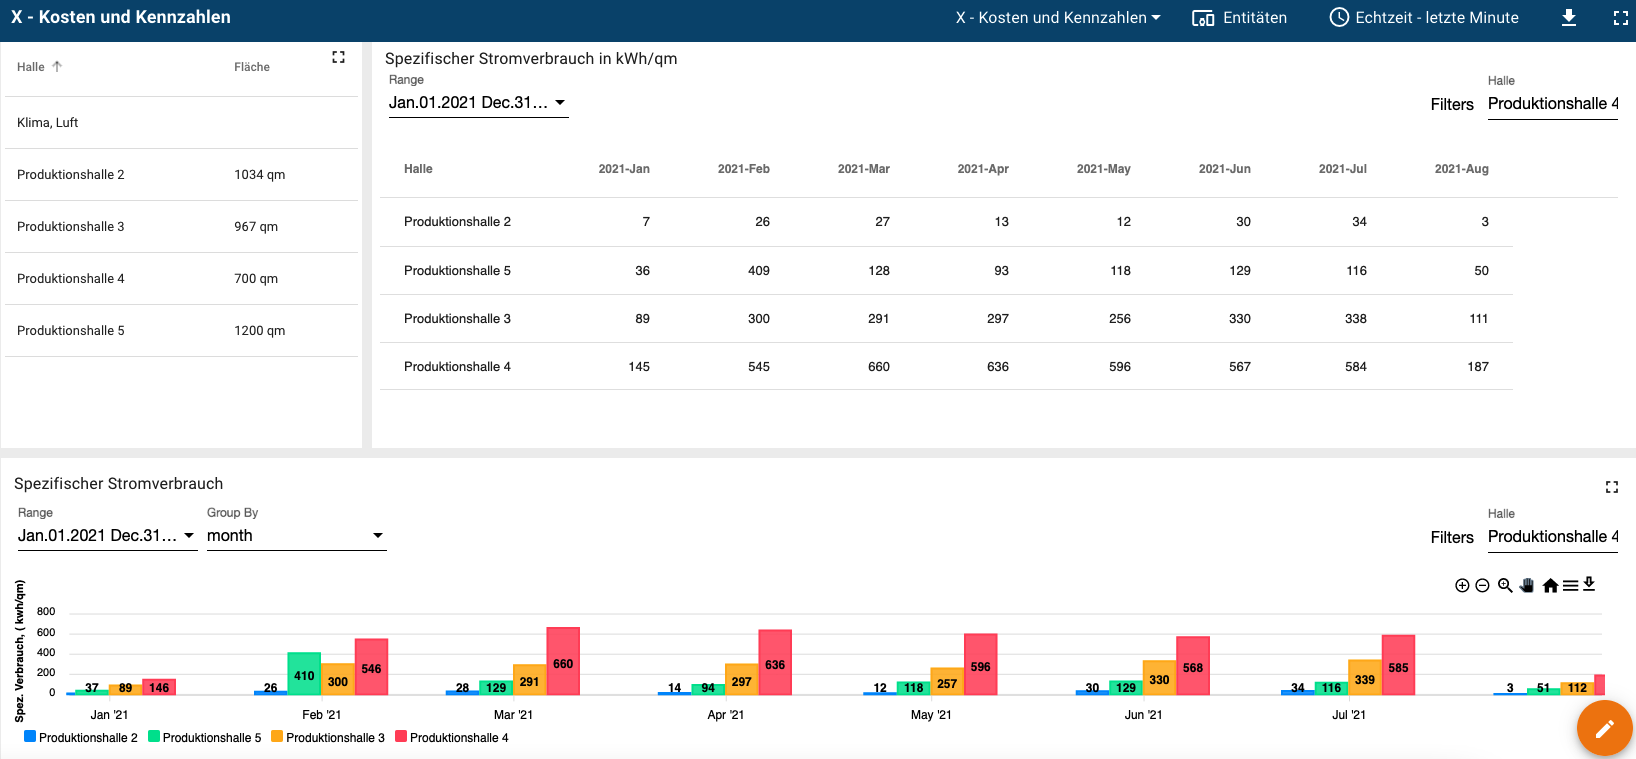
Corresponding dashboards are then created to visualize the key figures. In the following example dashboard, an overview of the properties, a table as an overview of the year and a diagram of the monthly key figure development were created.
¶ Energy consumption (absolute)
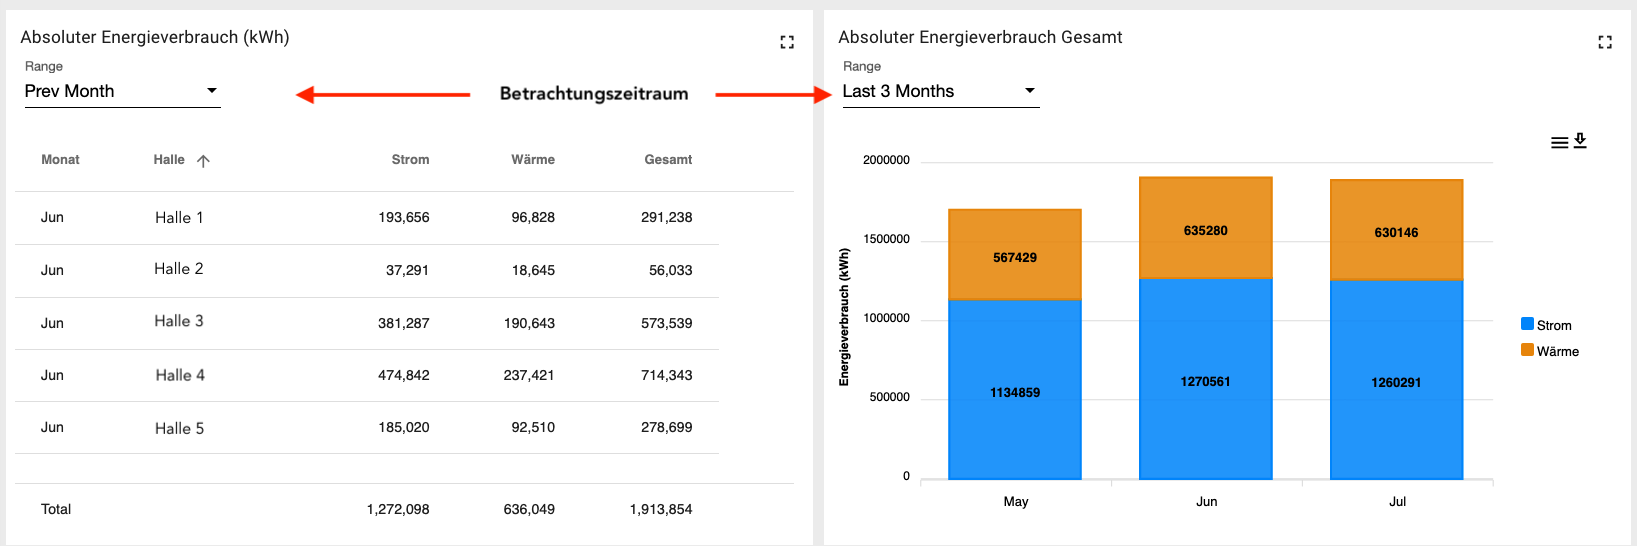
Create the corresponding widget to display the absolute energy consumption. You can find more information on the subject of widgets in the chapter Widgets.
In the following example, the absolute energy consumption of a production company is shown in tabular and graphic form.
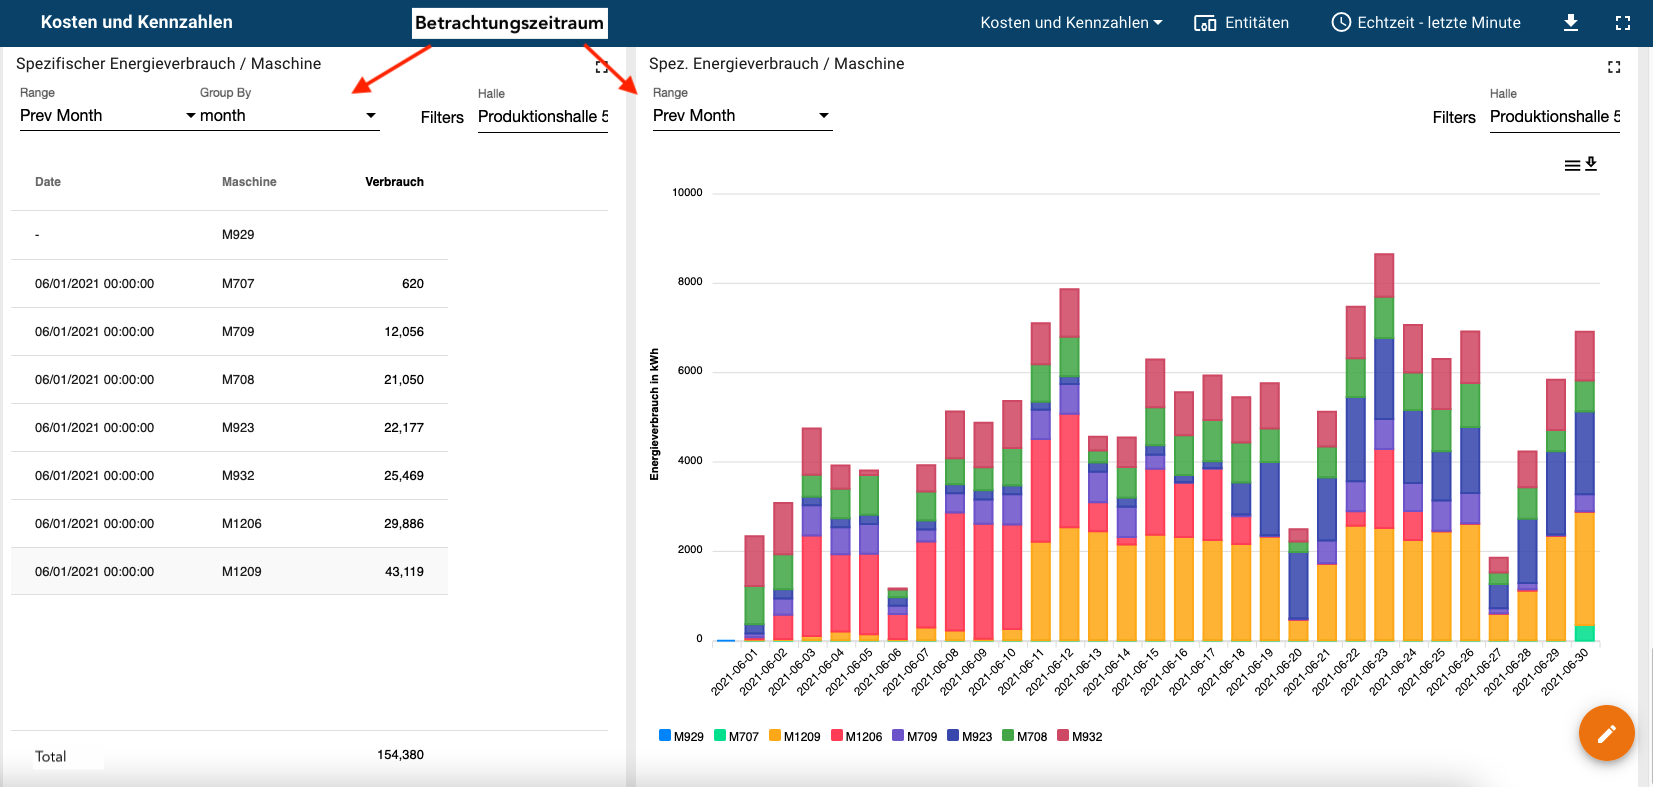
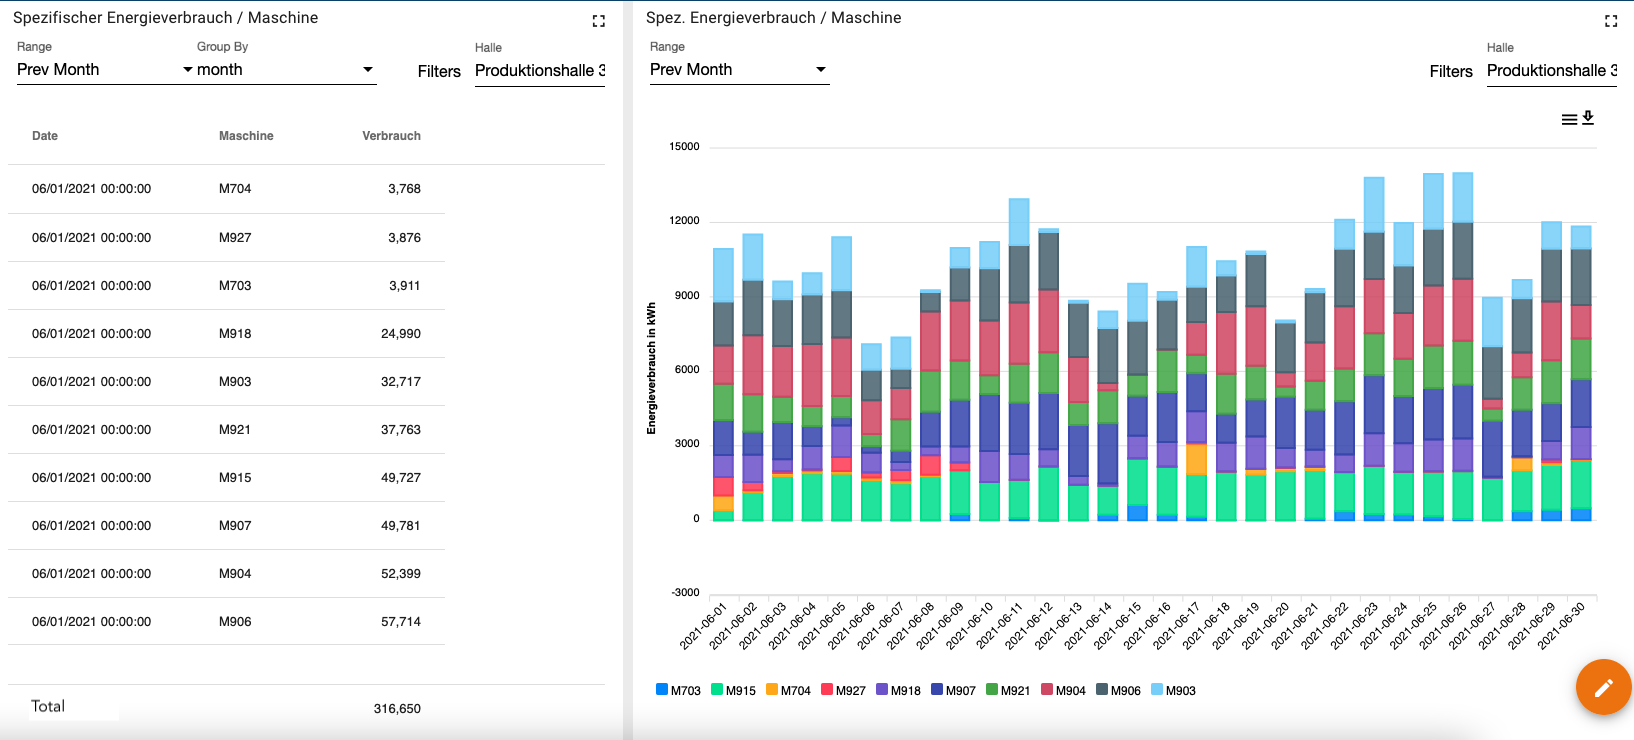
¶ Specific energy consumption
Create the corresponding widget to display the specific energy consumption. You can find more information on the subject of widgets in the chapter Widgets.
The following example shows the specific energy consumption of the machines in a hall. The observation period can be set individually. You can use the filter to filter the corresponding halls or machines.
¶ Electricity/Heat Consumption per reference Variable
Create the appropriate widget to display electricity/heat consumption per reference variable. You can find more information on the subject of widgets in the chapter Widgets.
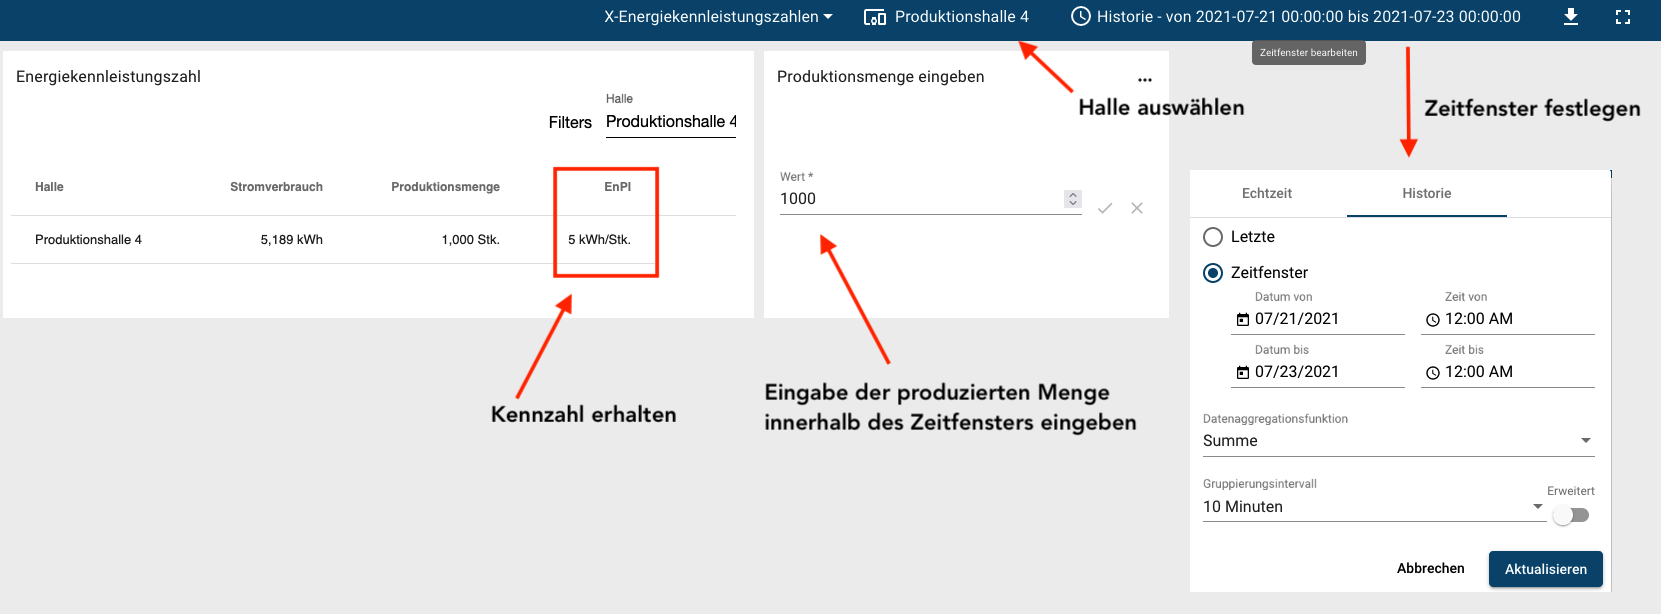
In the following dashboard, an overview of the current values was created on the left, a table of the energy consumption per reference variable as an annual overview on the right, and a diagram of the monthly key figure development underneath. The observation period can be set individually. You can use the filter to filter the corresponding halls or machines.
The following example shows a dashboard that calculates the power consumption per production volume of a hall. Use the time setting in the dashboard to set the production period and use a widget to specify the production quantity. Another widget gives you the key figure.
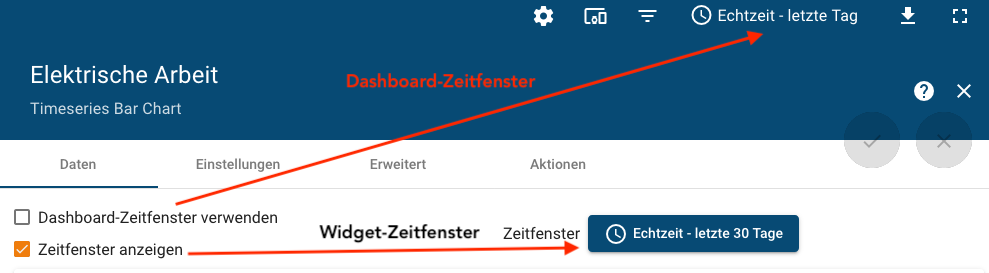
¶ Temporal Resolution of the Data
You determine the temporal resolution of your data via the time window settings of the dashboard time window or the widget time window. Select the settings option in the widget settings.
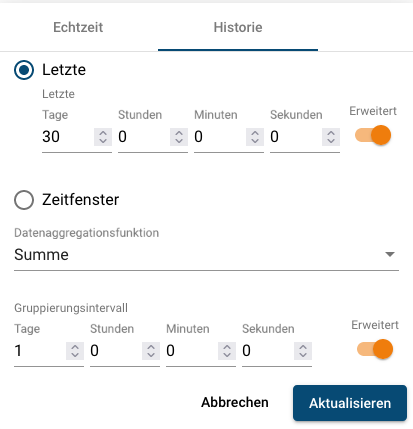
¶ Predetermined Time Intervals
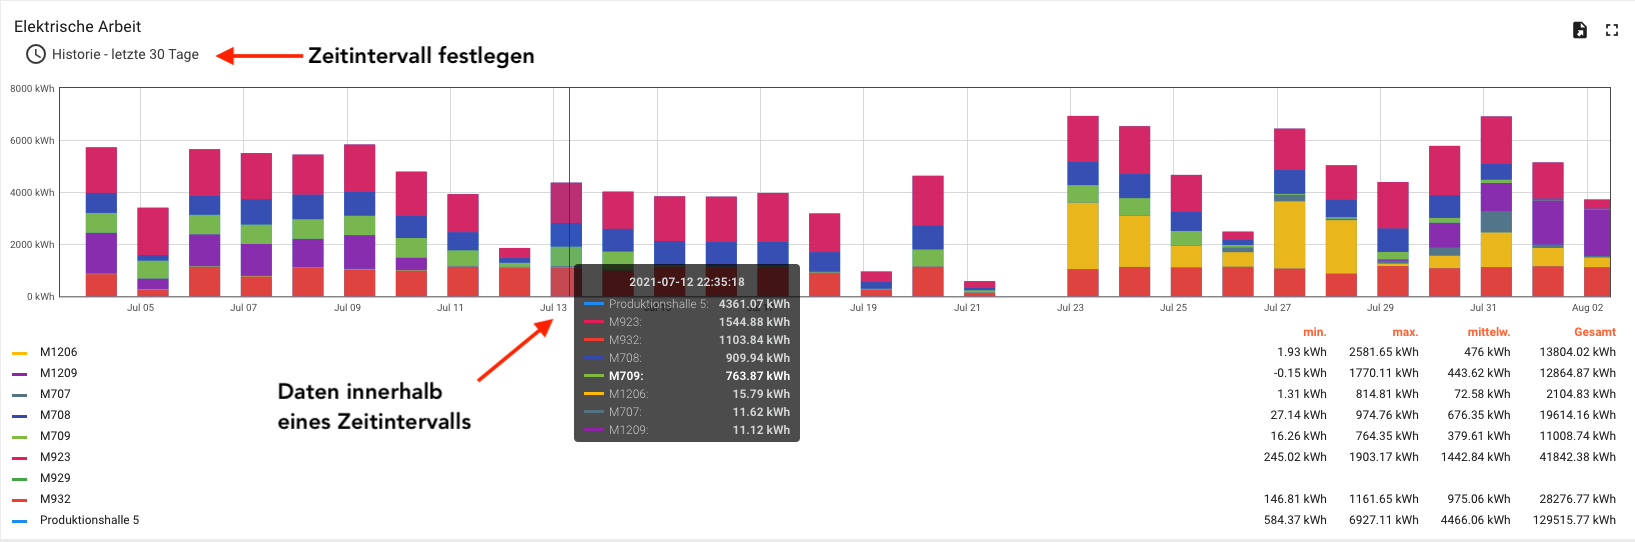
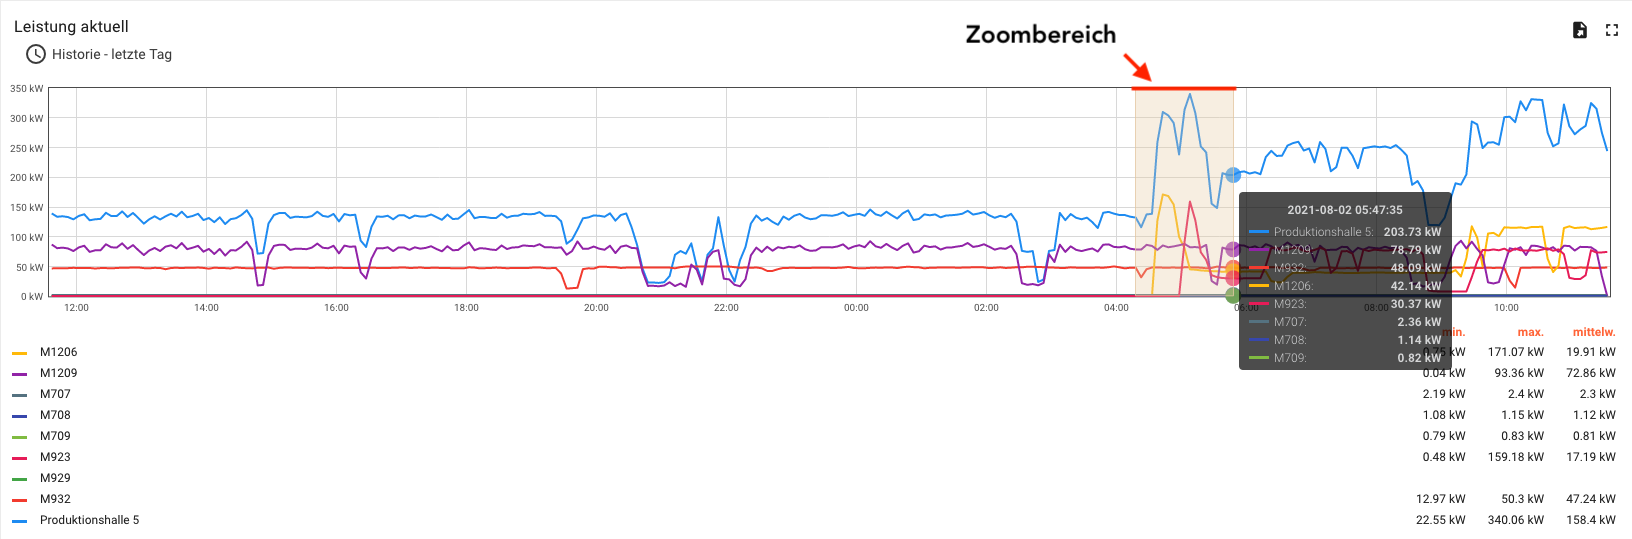
Set the time interval in the time slot settings. To do this, select a suitable grouping interval within the selected observation period. Drag your cursor to an interval to see the values.
 |
 |
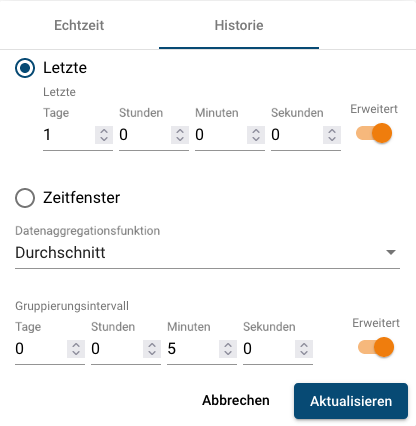
¶ Freely definable
Set the time interval in the time slot settings.
 |
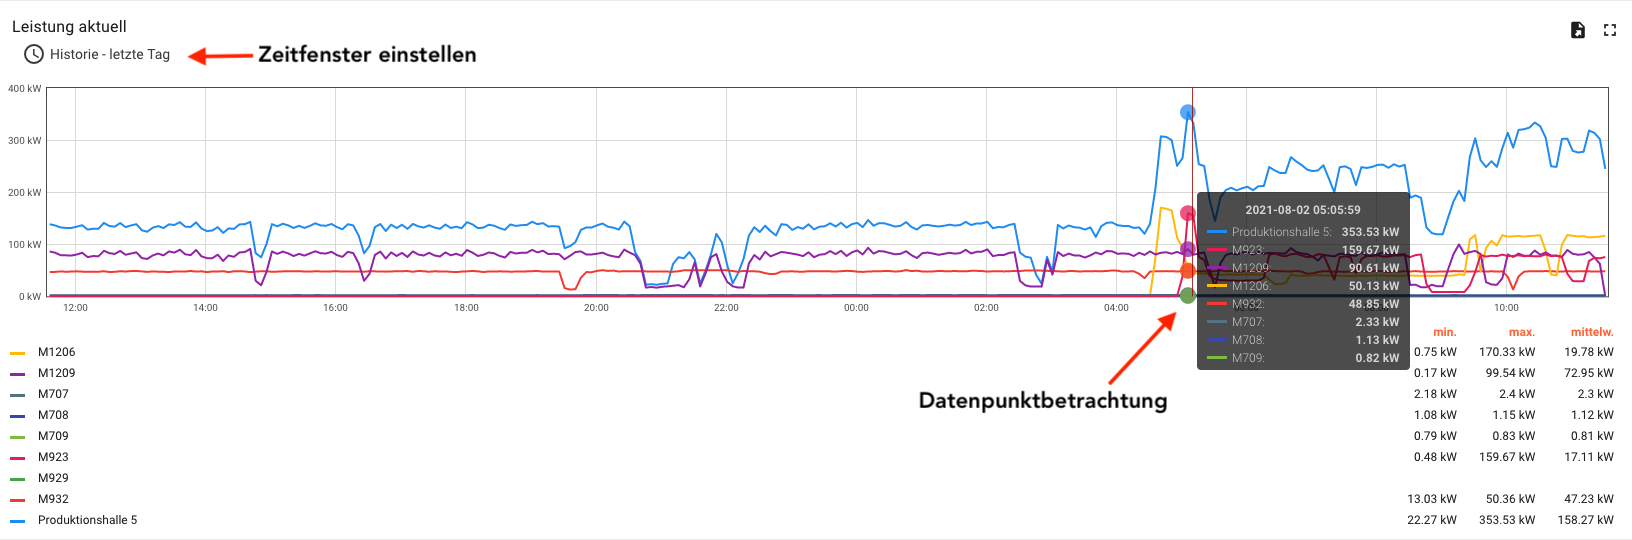 |
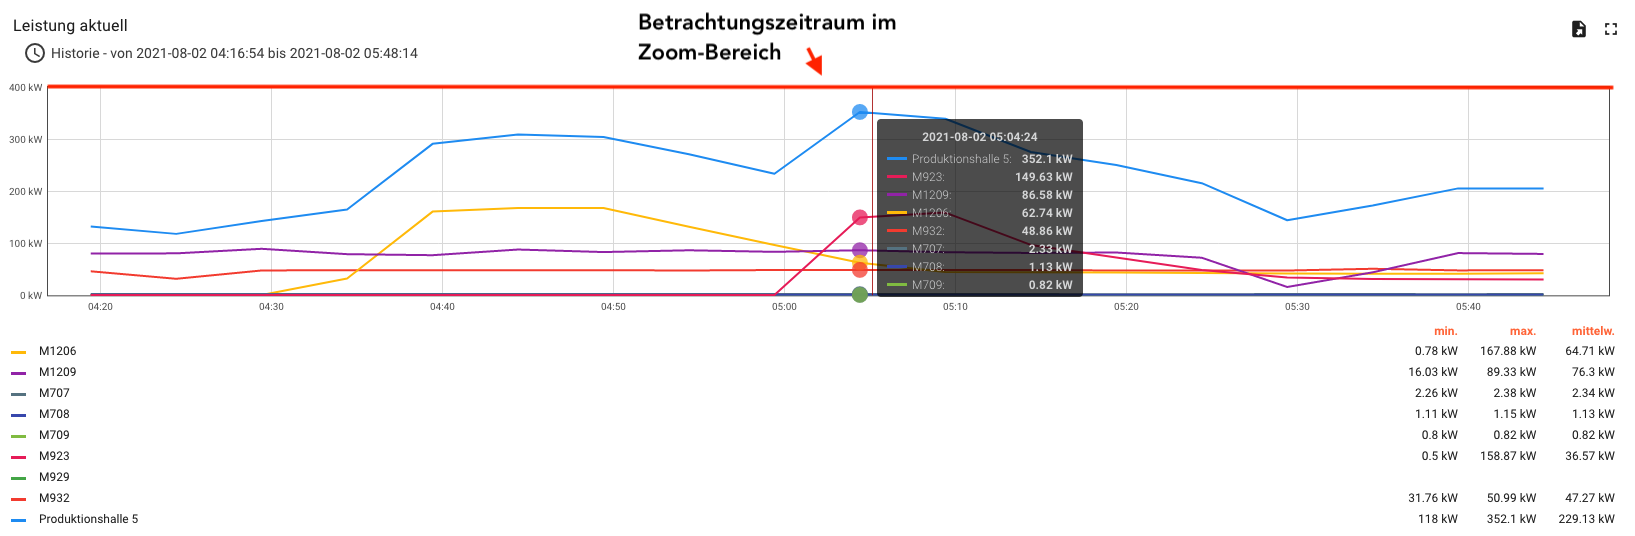
Use the zoom function to take a closer look at a desired period. Select an area in the chart. The zoom area is your new viewing period.
 |
 |
¶ Costing
Objects and their properties are used for cost determination. You can find more information on the subject of objects in the chapter Objekte.
¶ Energy Tariff Entry Function
You can assign your energy prices, providers or CO2 factors as properties to objects or devices. A production site with four production halls is taken as an example. Switch to the object menu and select the object in which the properties are to be created. In our example, we select the Production object. The production object has a superordinate relationship with all four production halls.
Go to Properties in the object details of the Production object. Enter the attributes for cost determination here.

¶ Cost Calculation
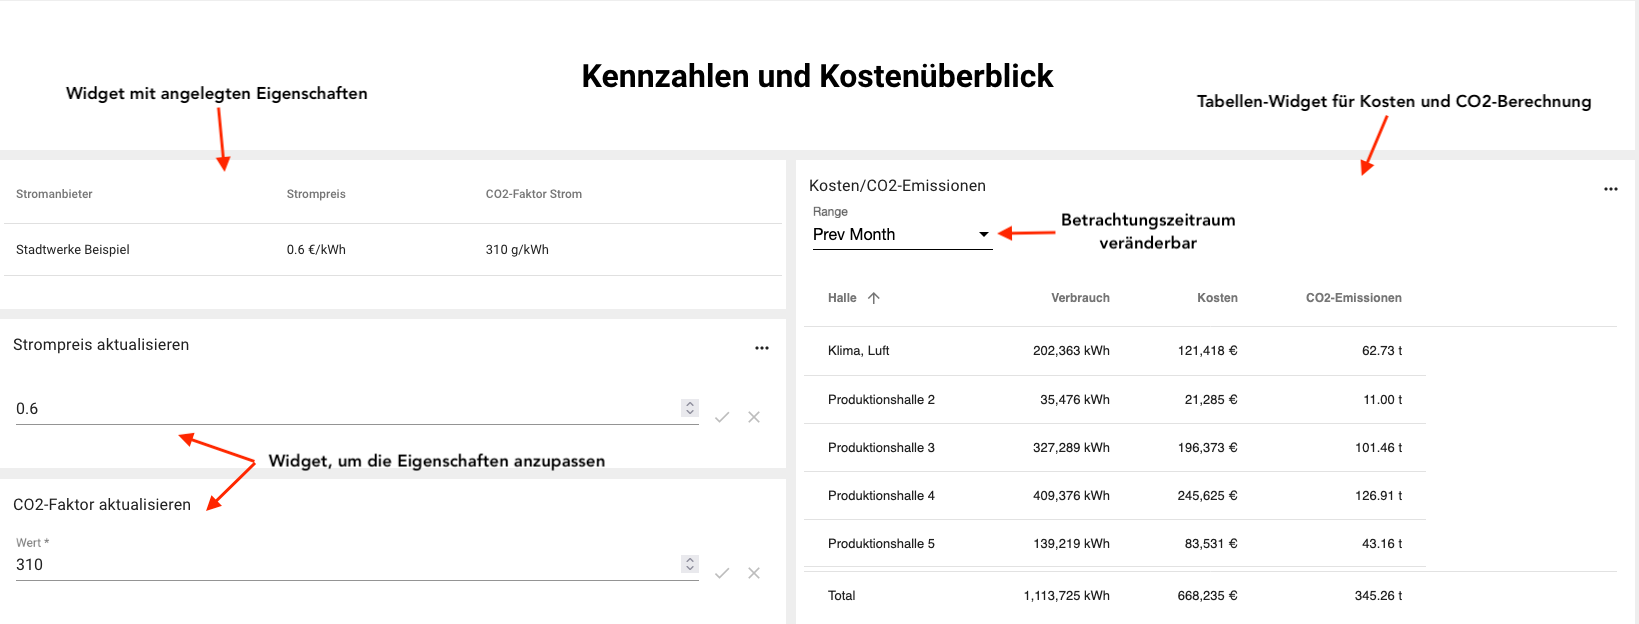
After you have created the energy prices in your property, you can create a suitable dashboard to display the costs.
The following example shows a dashboard showing the current properties. The values can be changed as required. Next to it is a table with the costs and CO2-emissions. You can select any observation period and filter according to the different halls.
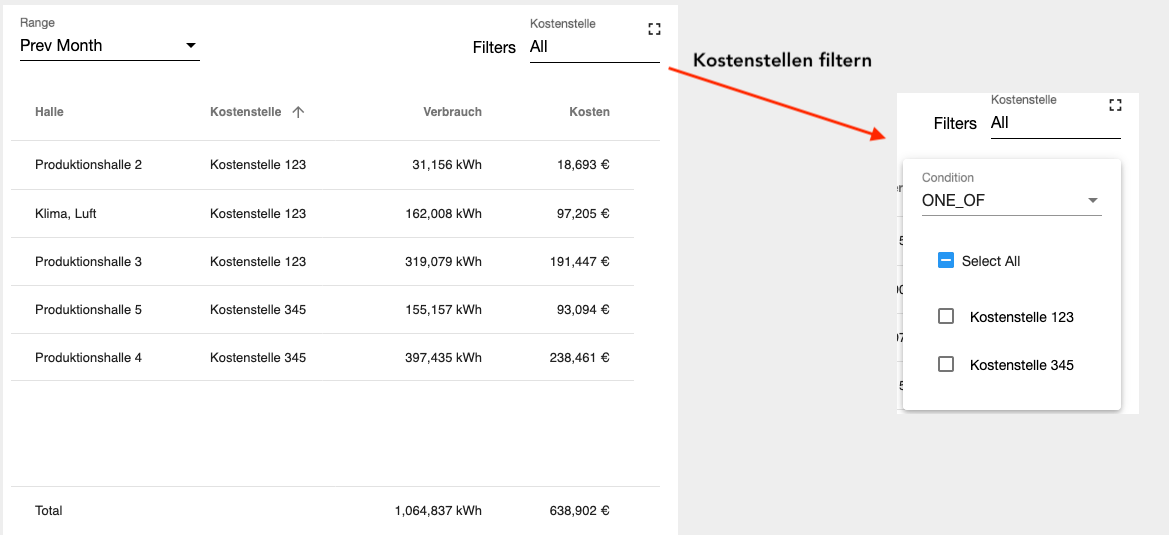
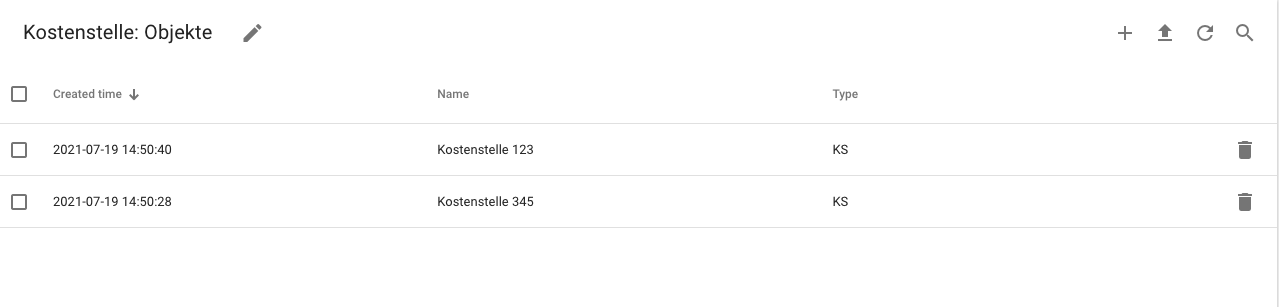
¶ Allocation of cost centers
Create a new object set Cost Center. Add your cost centers to the item set. Be sure to use a consistent object type.
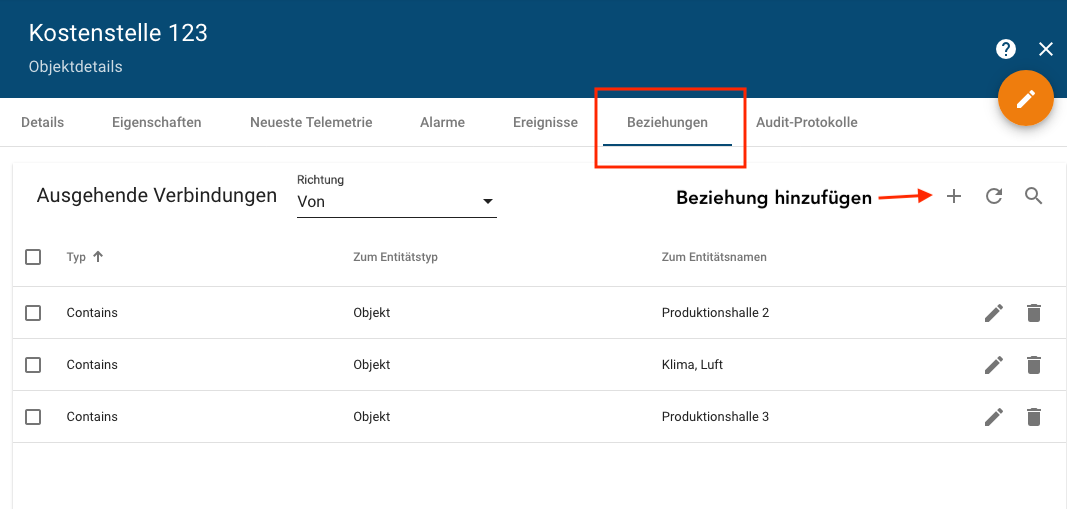
In the next step, you assign the halls/machines to the cost centers. To do this, go to the object details of the cost centers and add the appropriate objects in the Relationships area.
Create a cost center overview via a widget in the desired dashboard.
The example shows a table with the halls and the associated cost centers. You can display the cost centers separately in the filter.